

Market Valuation
Fairly Valued
Internet Computer
ICP
Bitcoin Cash
BCH
Litecoin
LTC
Investment Summary
 Market Valuation
Consensus
Playing
(BUY)
 Consensus
Best For
Capital Growth
 Best For
How This Company Makes Money
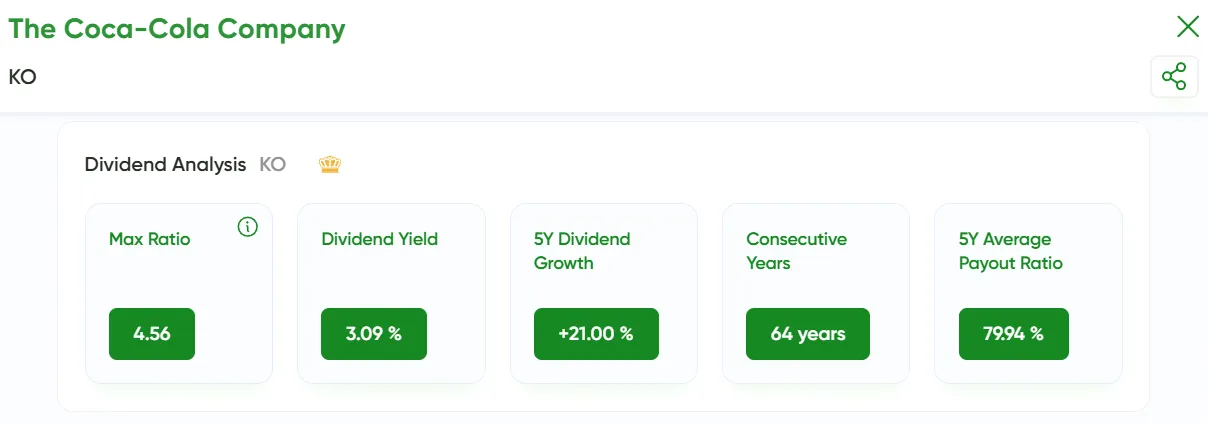
Dividend Snapshot META
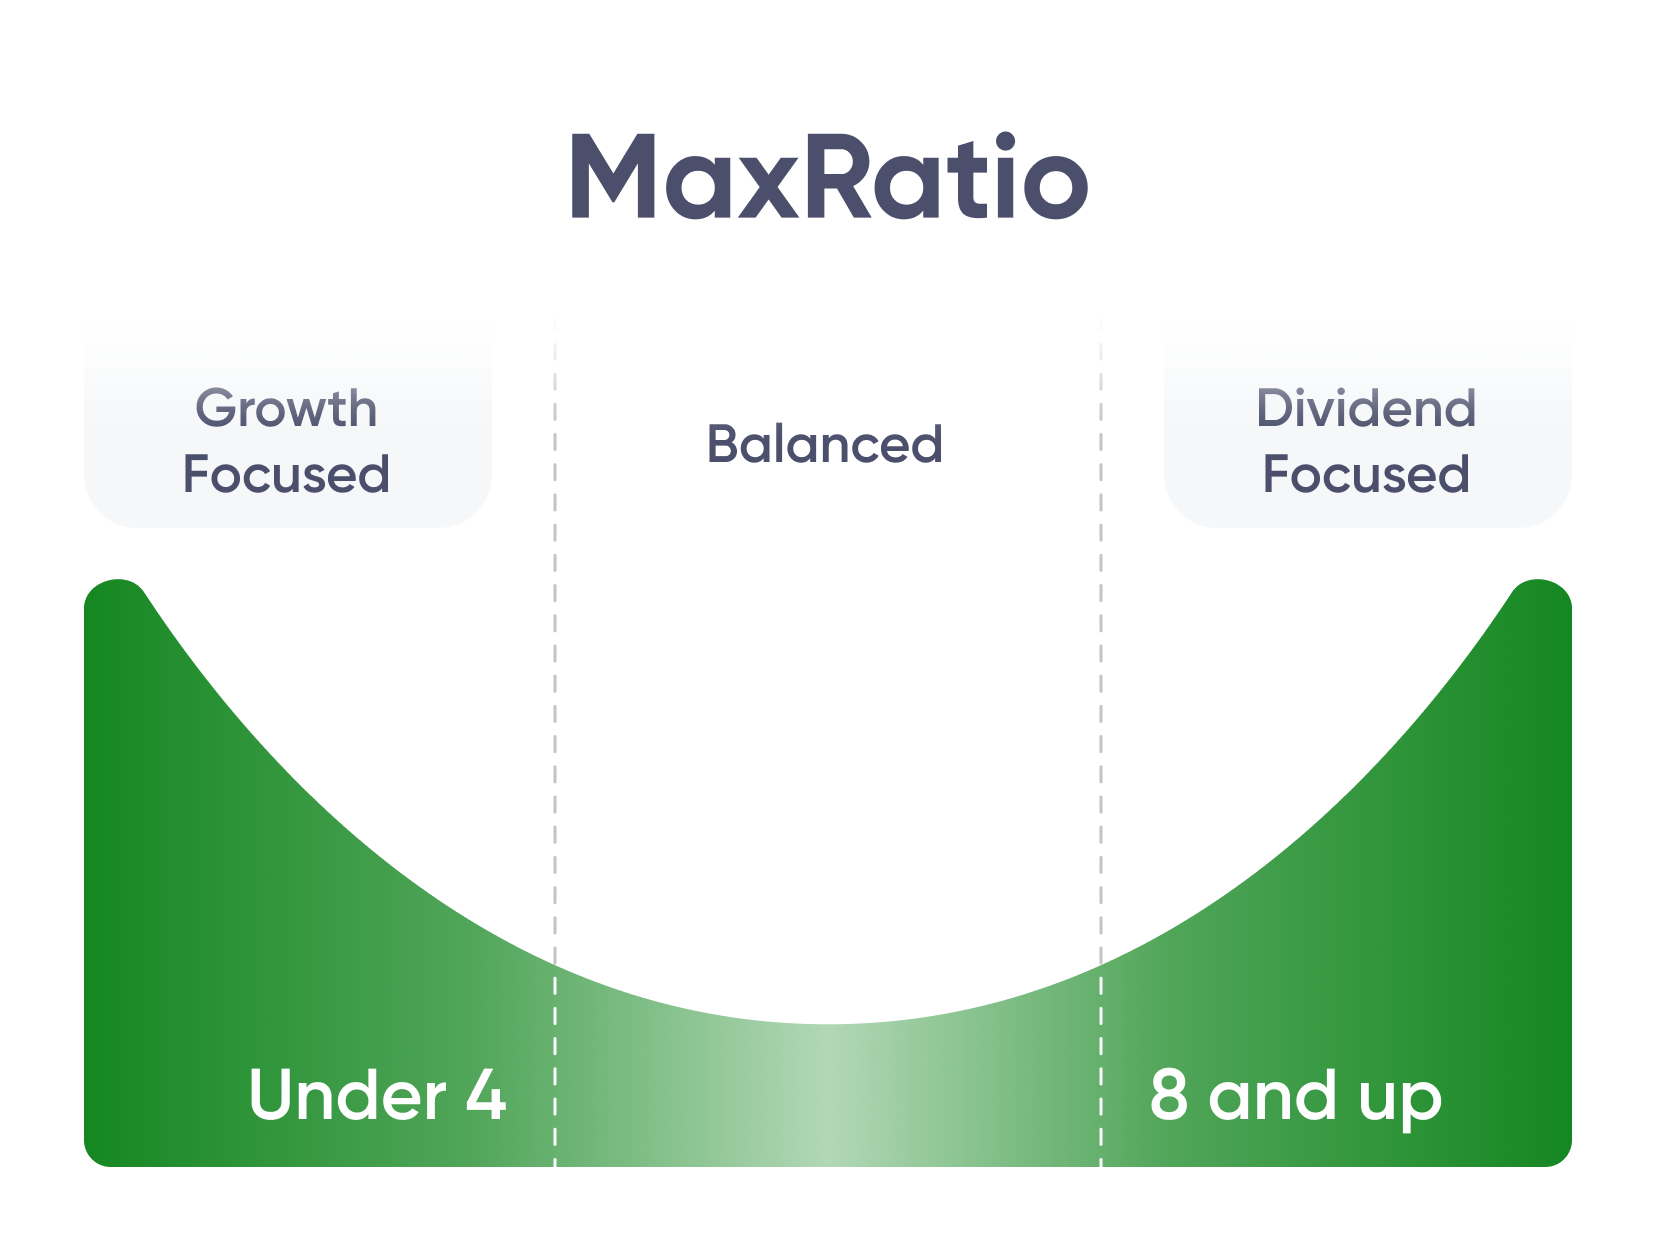
Max Ratio
–Dividend Yield
0.32 %5Y Dividend Growth
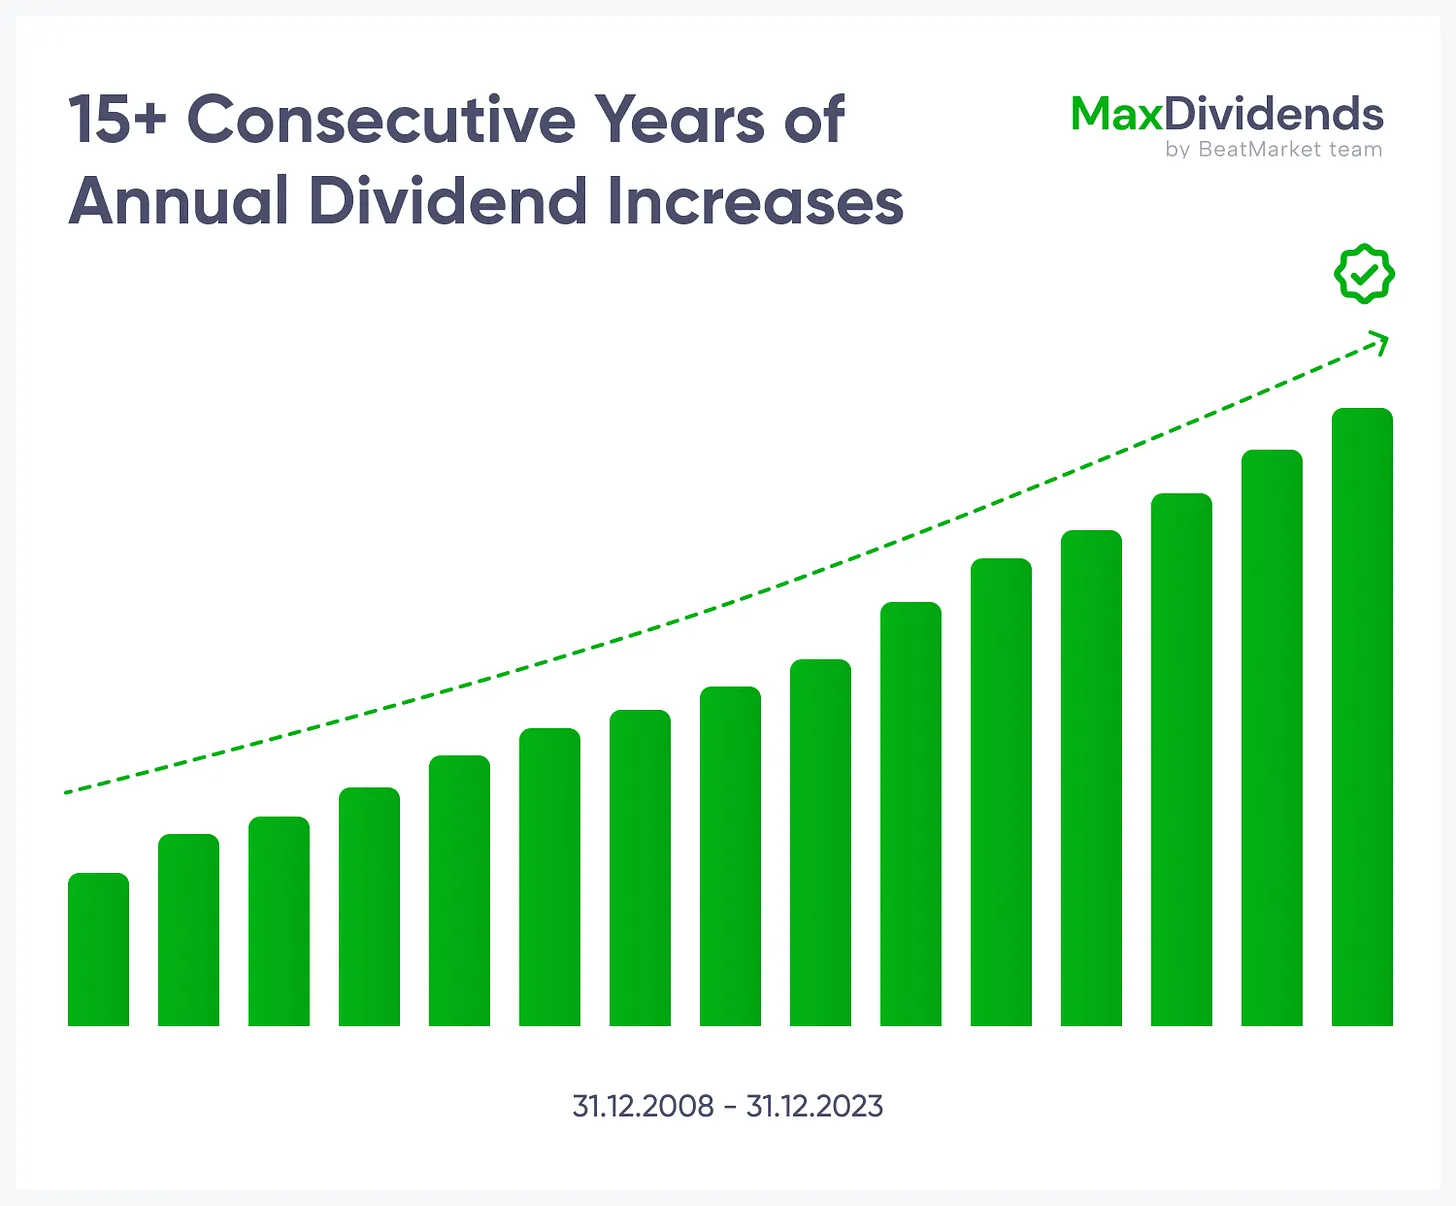
0.00 %Consecutive Years
1 year5Y Average Payout Ratio
5Y Average AFFO (EPRA) Payout Ratio
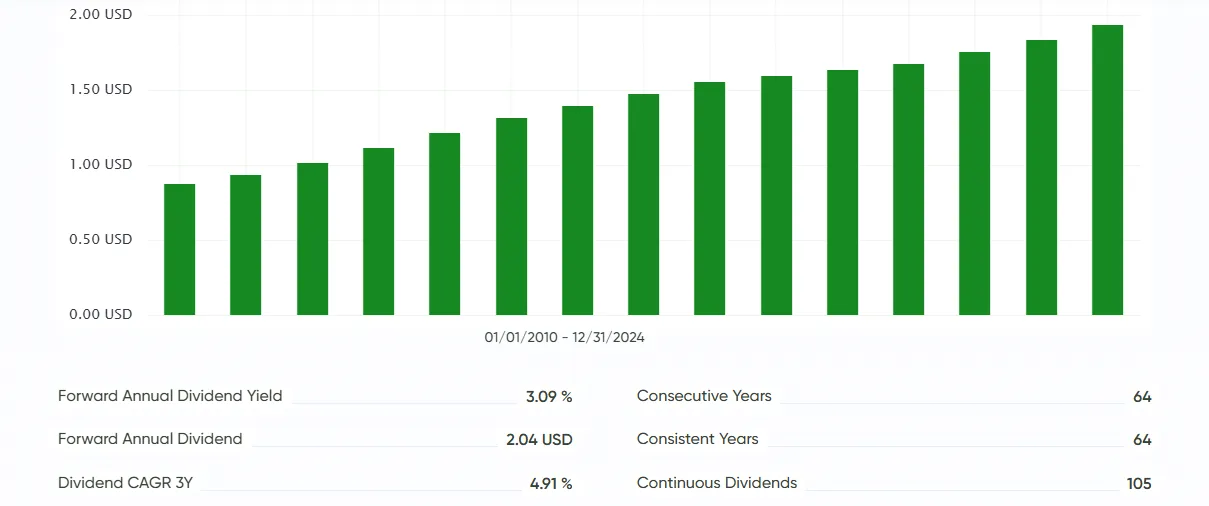
8.66 %Dividend History META
1 year
3 years
5 years
10 years
15 years
11/21/2021 - 11/28/2021
Forward Annual Dividend Yield
0.32 %
Consecutive Years
1
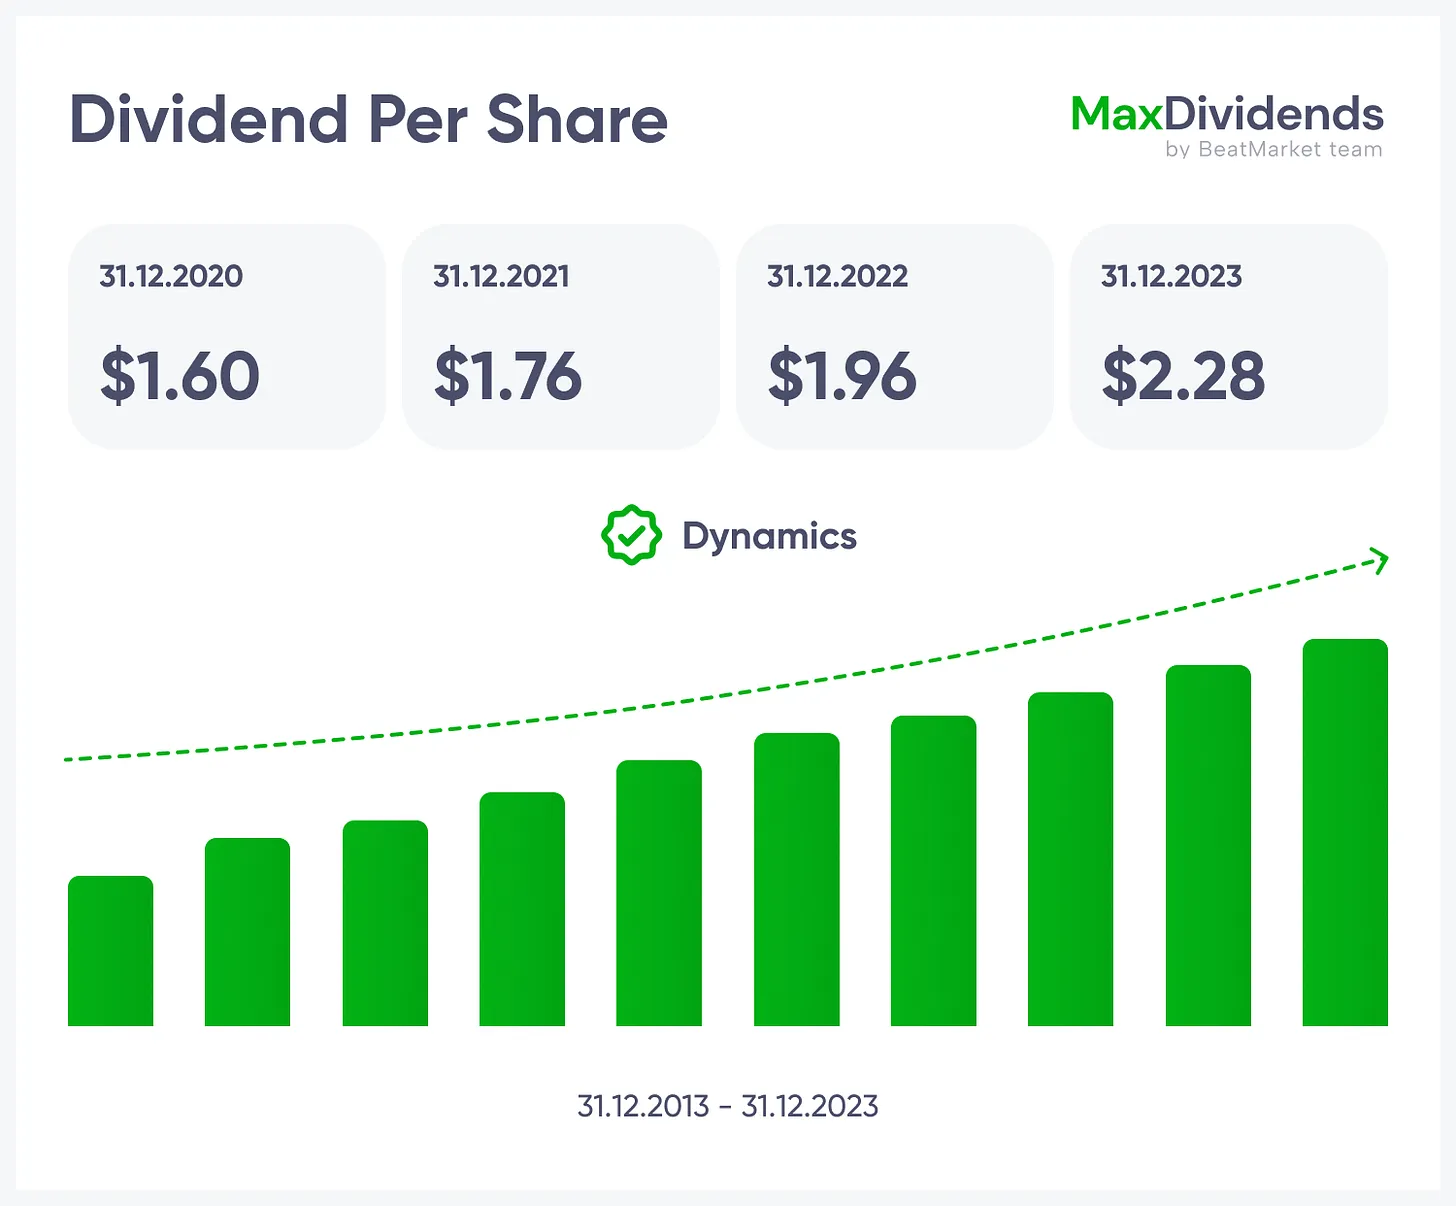
Forward Annual Dividend
2.10 USD
Consistent Years
1
Dividend CAGR 3Y
–
Continuous Dividends
2
Dividend CAGR 5Y
–
Payout Ratio TTM
7.92 %
Dividend CAGR 10Y
–
Ex Dividend Date
06/15/2026


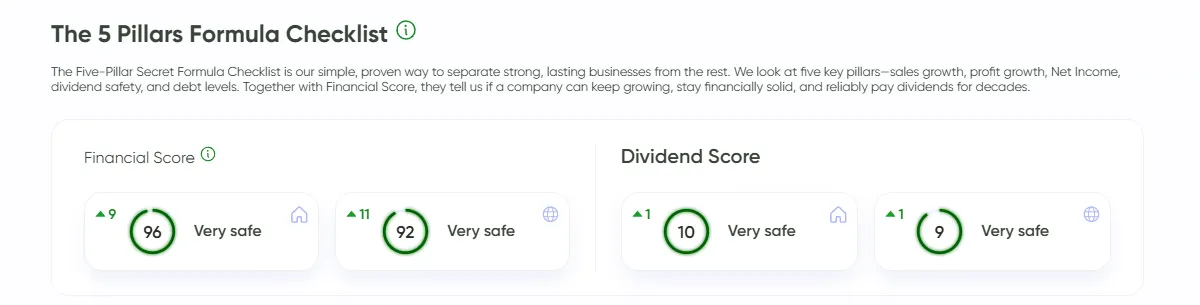
The 5 Pillars Formula Checklist
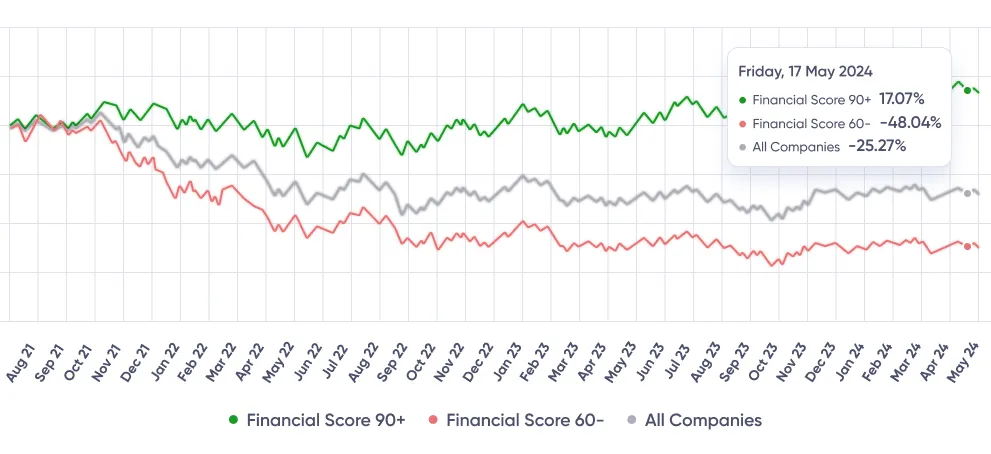
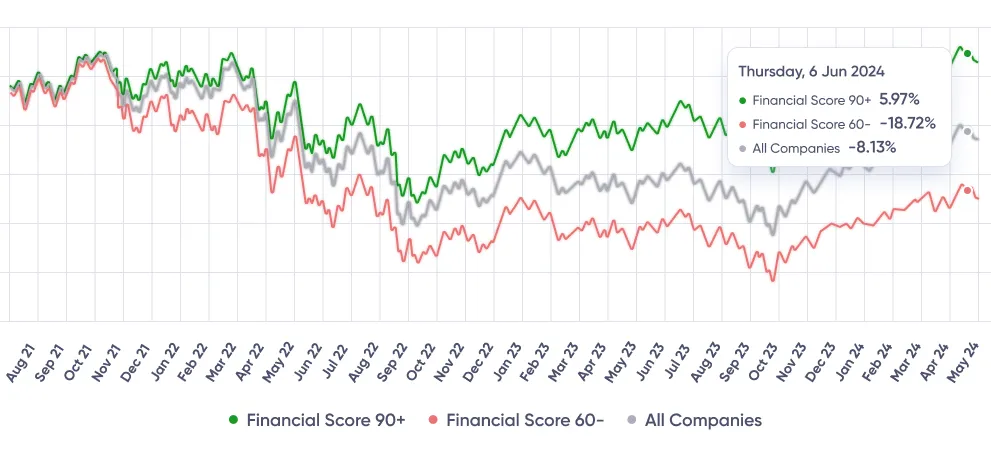
The Five-Pillar Secret Formula Checklist is our simple, proven way to separate strong, lasting businesses from the rest. We look at five key pillars—sales growth, profit growth, Net Income, dividend safety, and debt levels. Together with Business Quality Score, they tell us if a company can keep growing, stay financially solid, and reliably pay dividends for decades.MaxDividends Quality Score
Business Quality Score
Dividend Score
Sales Growth META
1 year
3 years
5 years
10 years
Profit Growth / Profit Margin META
1 year
3 years
5 years
10 years
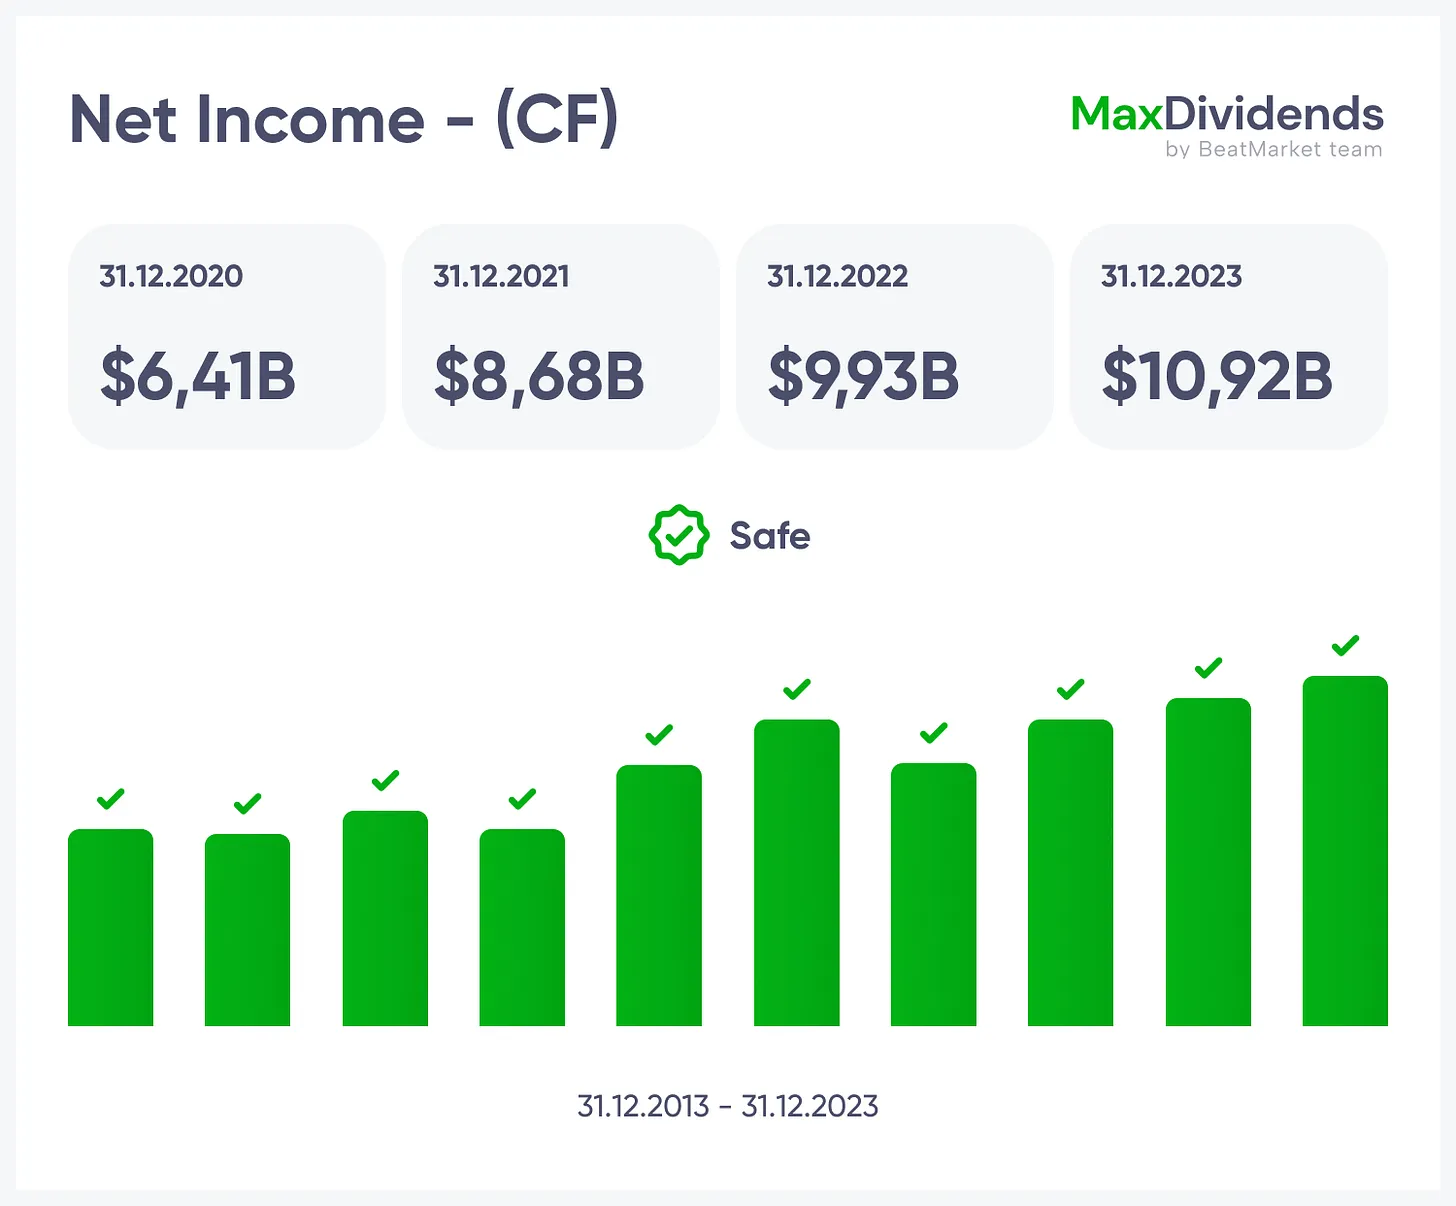
Net Income META
1 year
3 years
5 years
10 years
Payout Ratio TTM META
1 year
3 years
5 years
10 years
15 years
11/21/2021 - 11/28/2021
Debt Ratio META
1 year
3 years
5 years
10 years
11/21/2021 - 11/28/2021
Full Financial Performance
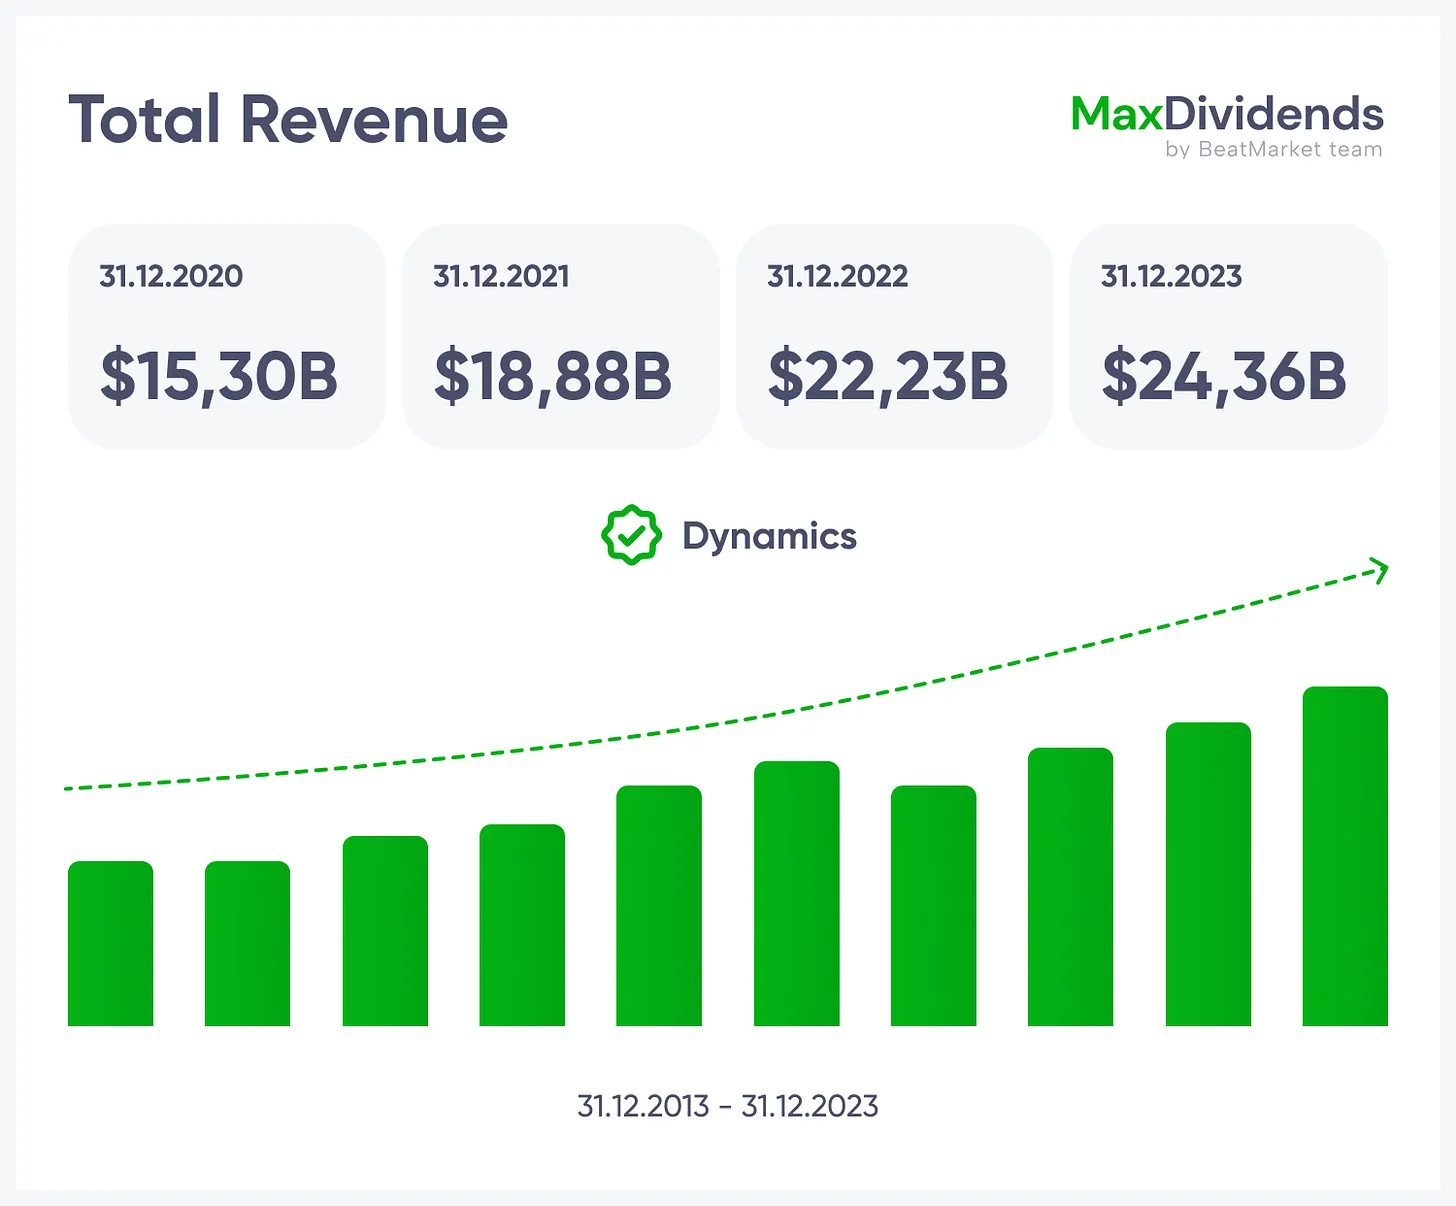
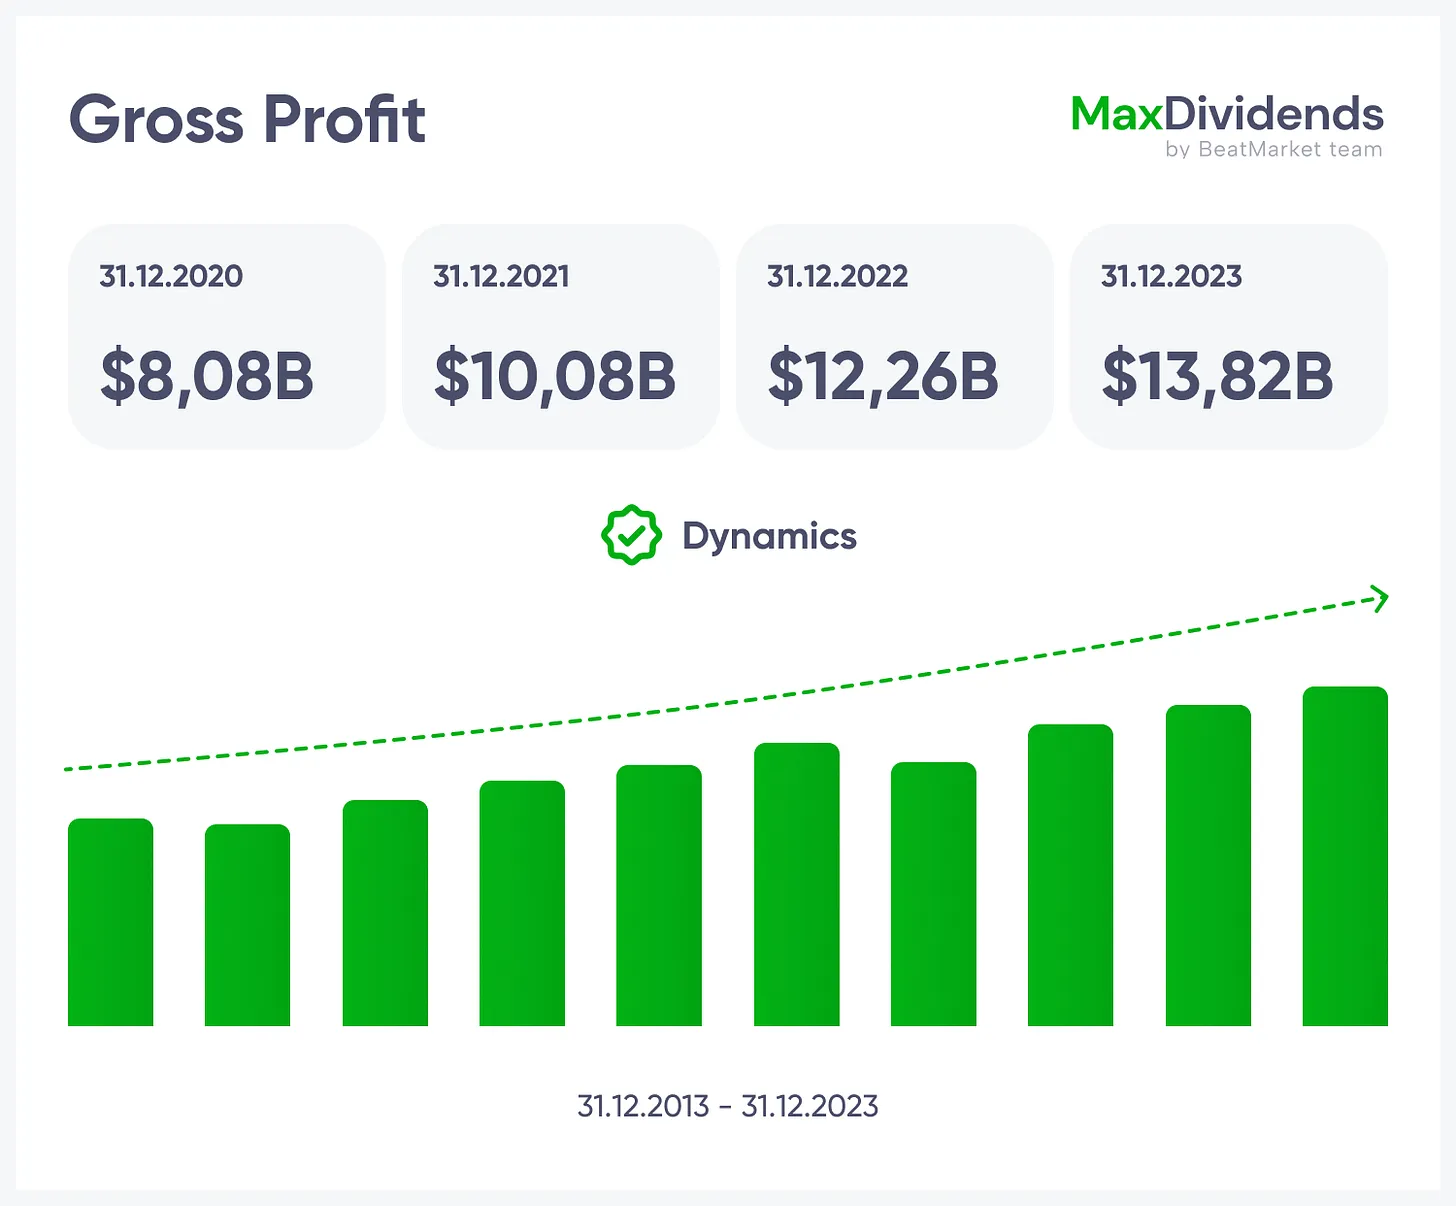
See how the company makes money over time—revenue, profits, dividends, and more. The charts on the right give you a quick view of growth trends so you can instantly spot consistency or red flags.
Meta Platforms Inc. META
1 year
3 years
5 years
10 years
| Results | 2019 | Dynamics |
* The data for this period has not yet been published
Valuation Check
Shows if a stock is priced fairly by looking at peers and the company’s own history — a quick way to see if it’s a bargain or overpriced.Value vs Itself META
1 year
3 years
5 years
10 years
11/21/2021 - 11/28/2021
Trailing PE
22.32
Forward PE
17.15
Enterprise Value Revenue
6.55
Price Sales TTM
6.82
Enterprise Value EBITDA
13.32
Price Book MRQ
5.64
Bottom Line
Meta Platforms Inc.
METACurrent price
653.69 USD
+5.05 USD (+0.78%)
Last closed
613.48 USD
Company
investor.fb.com
ISIN
US30303M1027
Sector
Communication Services
Industry
Internet Content & Information
Exchange
NASDAQ
Capitalization
1 555 711 000 576 USD
Yield for 12 month
-13.07 %
1Y
3Y
5Y
10Y
15Y
META
Advanced Highlights
Current Year
+200 966 000 000 USD
Last Year
+164 501 000 000 USD
Current Quarter
+60 801 000 000 USD
Last Quarter
+56 311 000 000 USD
Current Year
+164 791 000 000 USD
Last Year
+134 340 000 000 USD
Current Quarter
+49 471 000 000 USD
Last Quarter
+46 093 000 000 USD
EBITDA
109 654 999 040 USD
Operating Margin TTM
Price to Earnings
22.32
Return On Assets TTM
14.59 %
PEG Ratio
0.77
Return On Equity TTM
29.85 %
Wall Street Target Price
754.77 USD
Revenue TTM
228 246 994 944 USD
Book Value
102.52 USD
Revenue Per Share TTM
90.25 USD
Dividend Share
2.10 USD
Quarterly Revenue Growth YOY
28.00 %
Dividend Yield
0.32 %
Gross Profit TTM
186 586 005 504 USD
Earnings Per Share
27.36 USD
Diluted EPS TTM
27.36 USD
Most Recent Quarter
II 2026
Quarterly Earnings Growth YOY
-13.40 %
Profit Margin
29.83 %
Price to Free Cash Flow TTM
35.18
Technical Indicators META
For 52 Weeks
519.78 USD
788.22 USD
50 Day MA
592.95 USD
Shares Short Prior Month
31 458 758
200 Day MA
622.21 USD
Short Ratio
1.73
Shares Short
28 048 106
Short Percent
1.27 %








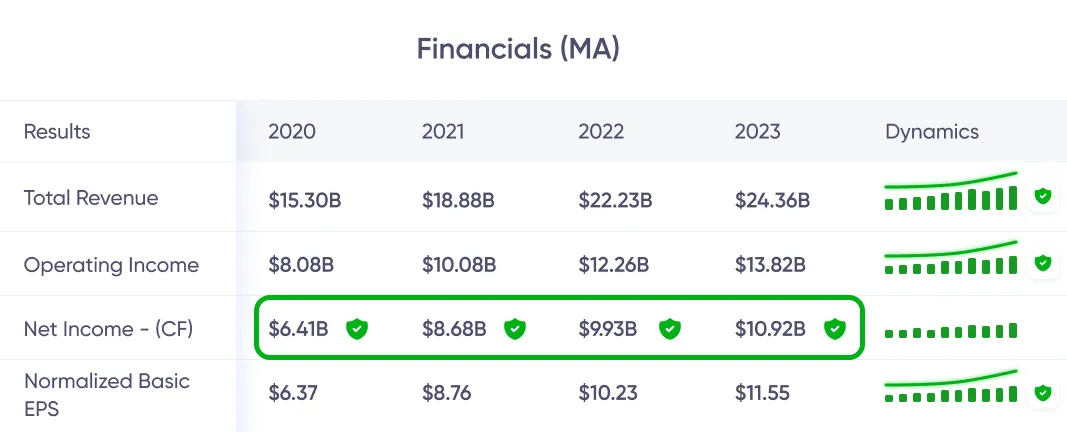
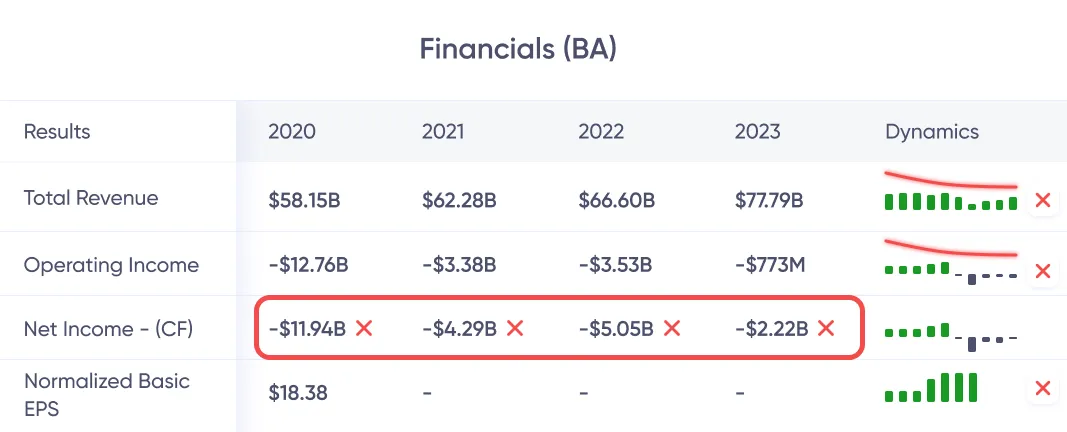


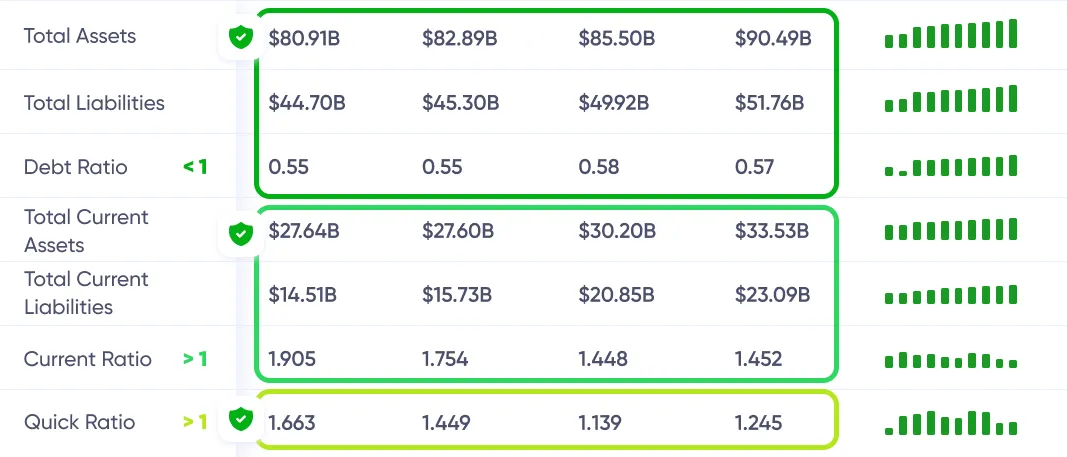
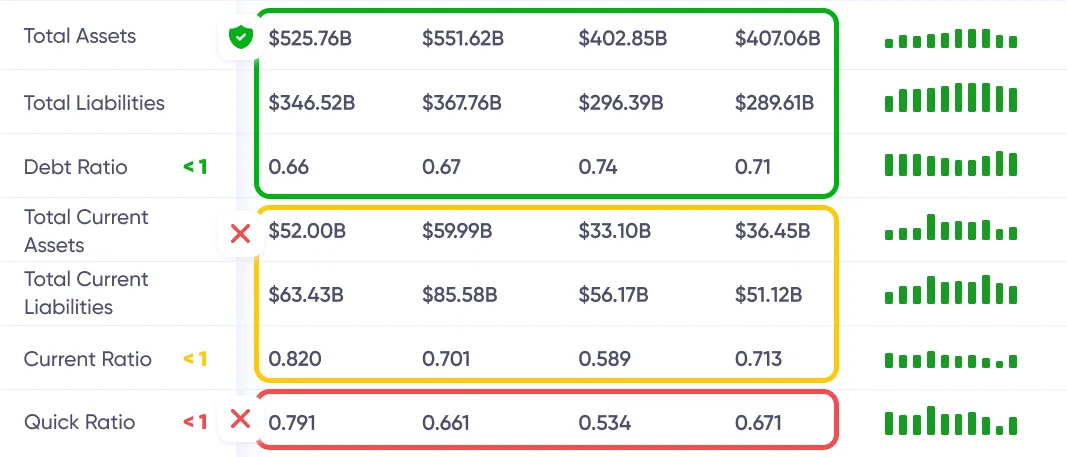

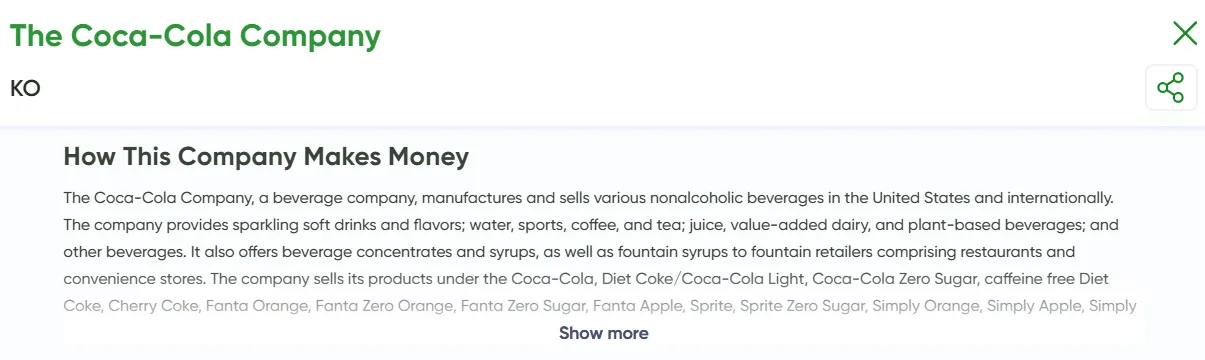 See the whole business at a glance — what it does, how it earns, and the value it brings.
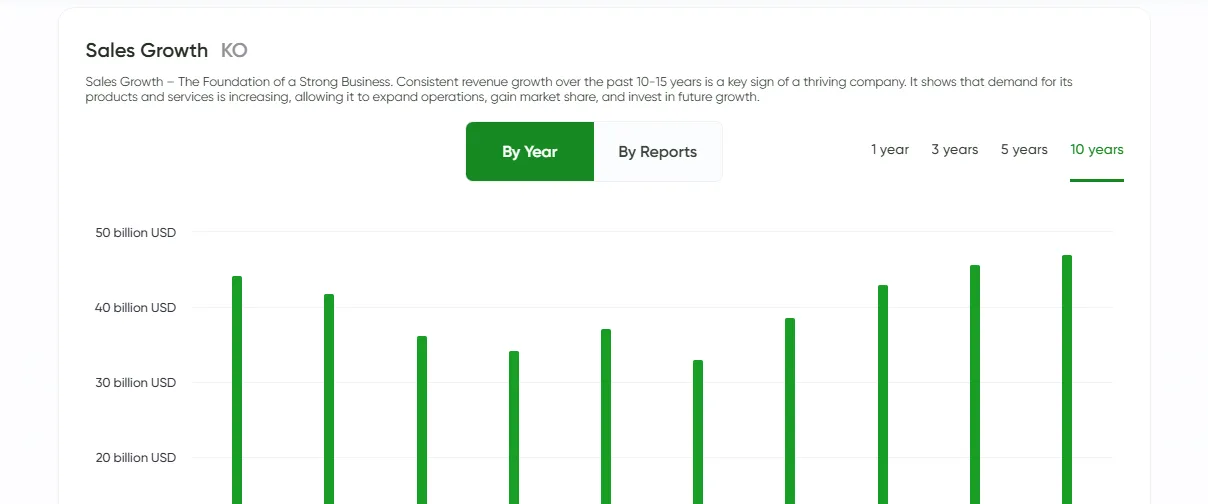 Growth trend, clear in one glance.
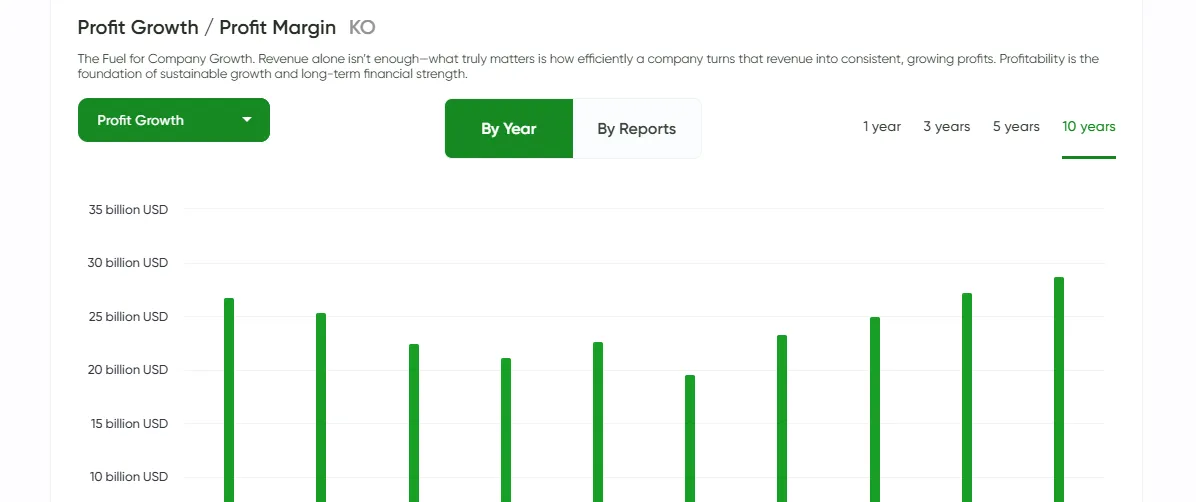 See if profits are real — instantly.
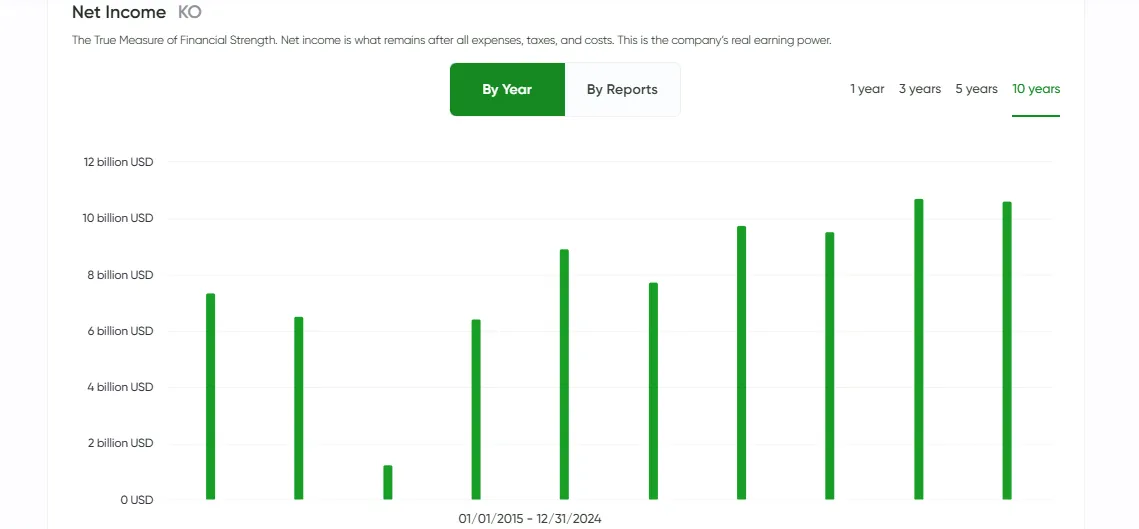 Bottom line made simple with MaxDividends.
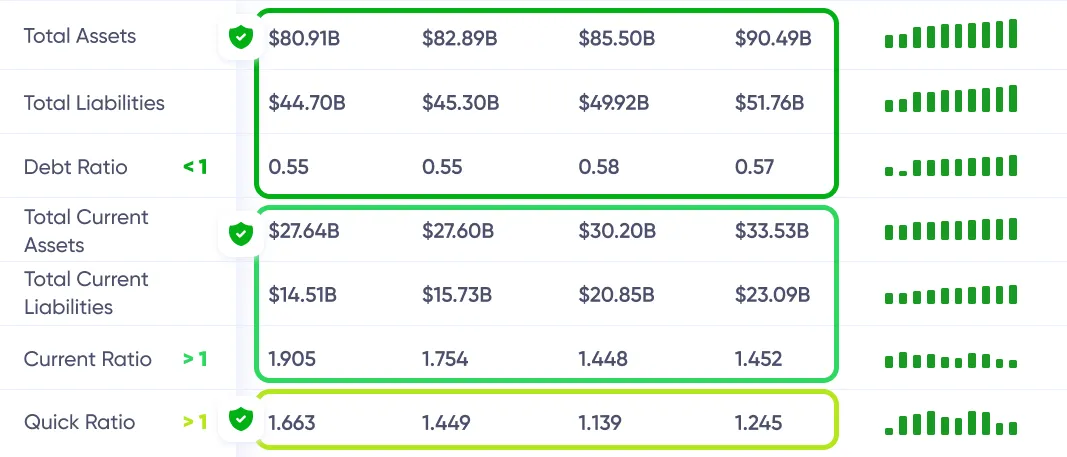
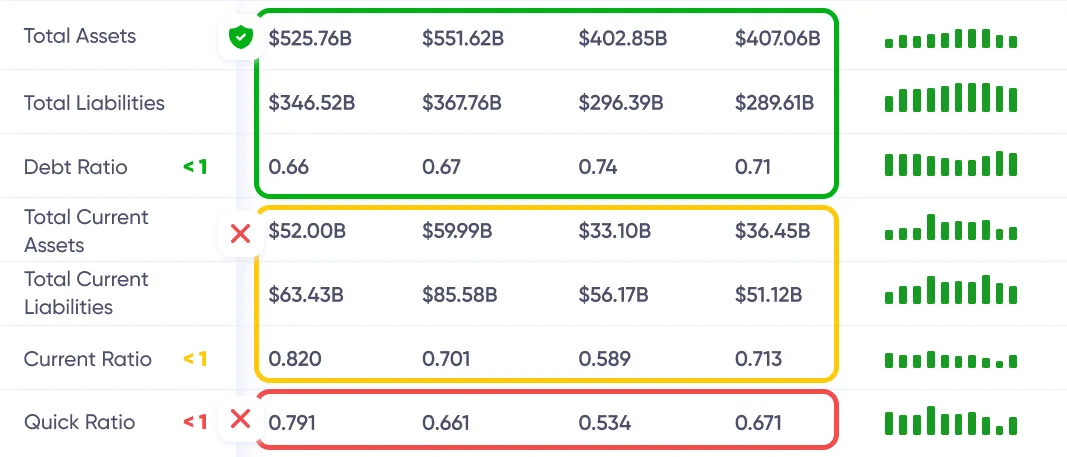
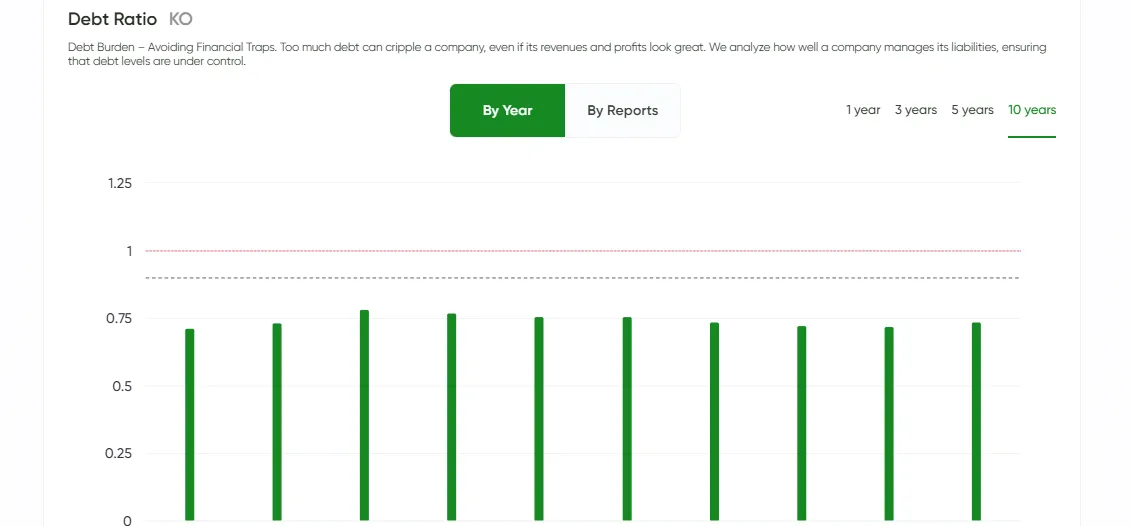 Debt risk checked for you, 24/7.
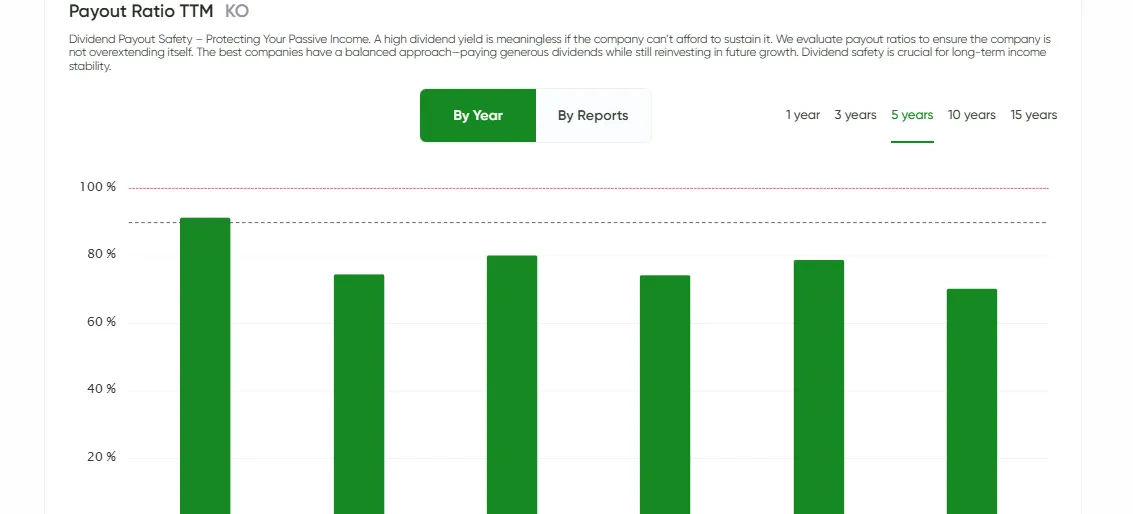 Dividend streaks and raises at your fingertips.
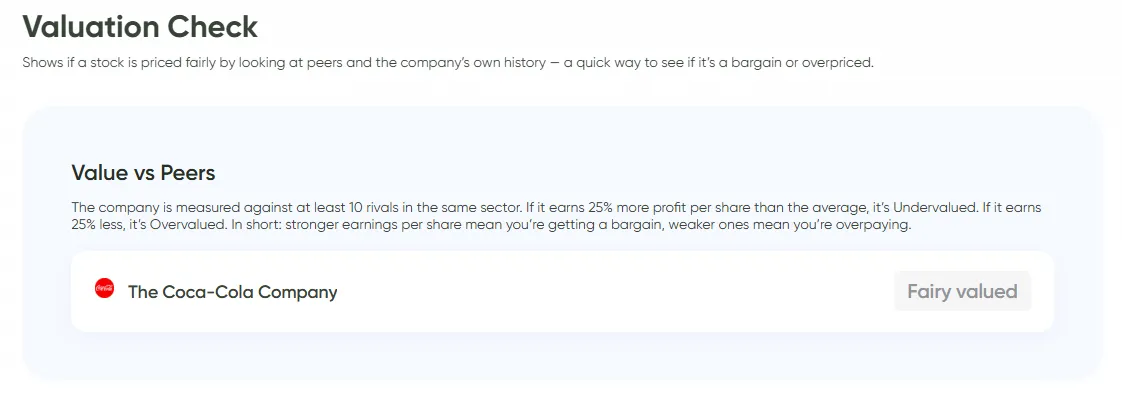 Stack the company against rivals. If it earns more per share, it's undervalued. If less, overpriced.
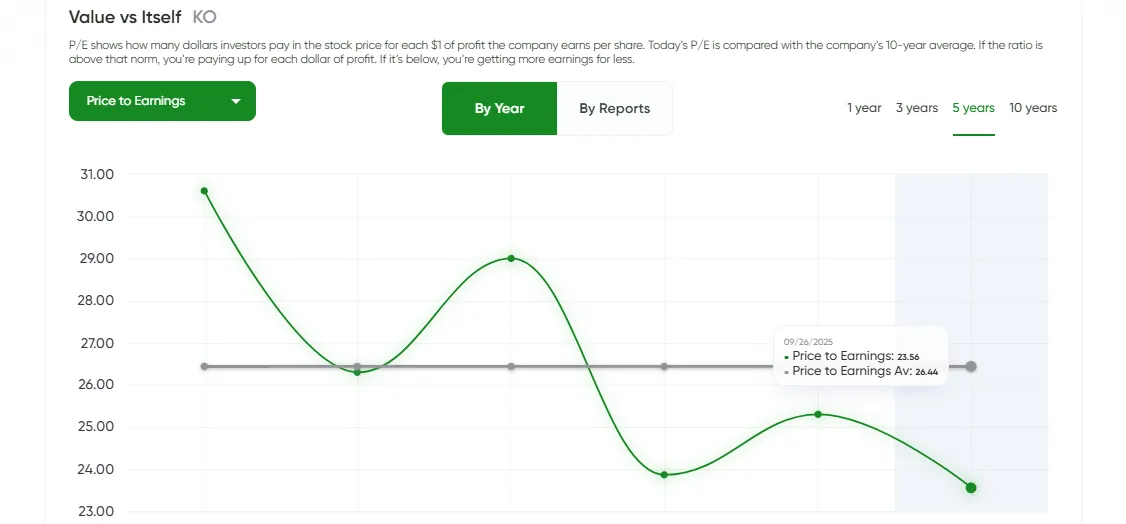 Compare today's P/E with its own 10-year history. Above average = expensive. Below = bargain.
 See if the stock trades below its assets. That's buying the business with built-in margin of safety.

 BeatStart