
Market Valuation
Évalué de manière juste
Internet Computer
ICP
Bitcoin Cash
BCH
Litecoin
LTC
Précisez une action ou une cryptomonnaie dans la barre de recherche pour obtenir un récapitulatif
Internet Computer
ICP
Bitcoin Cash
BCH
Litecoin
LTC

 Market Valuation
 Consensus
 Best For
Comment Cette Entreprise Gagne de l'Argent
Analyse des dividendes PACW
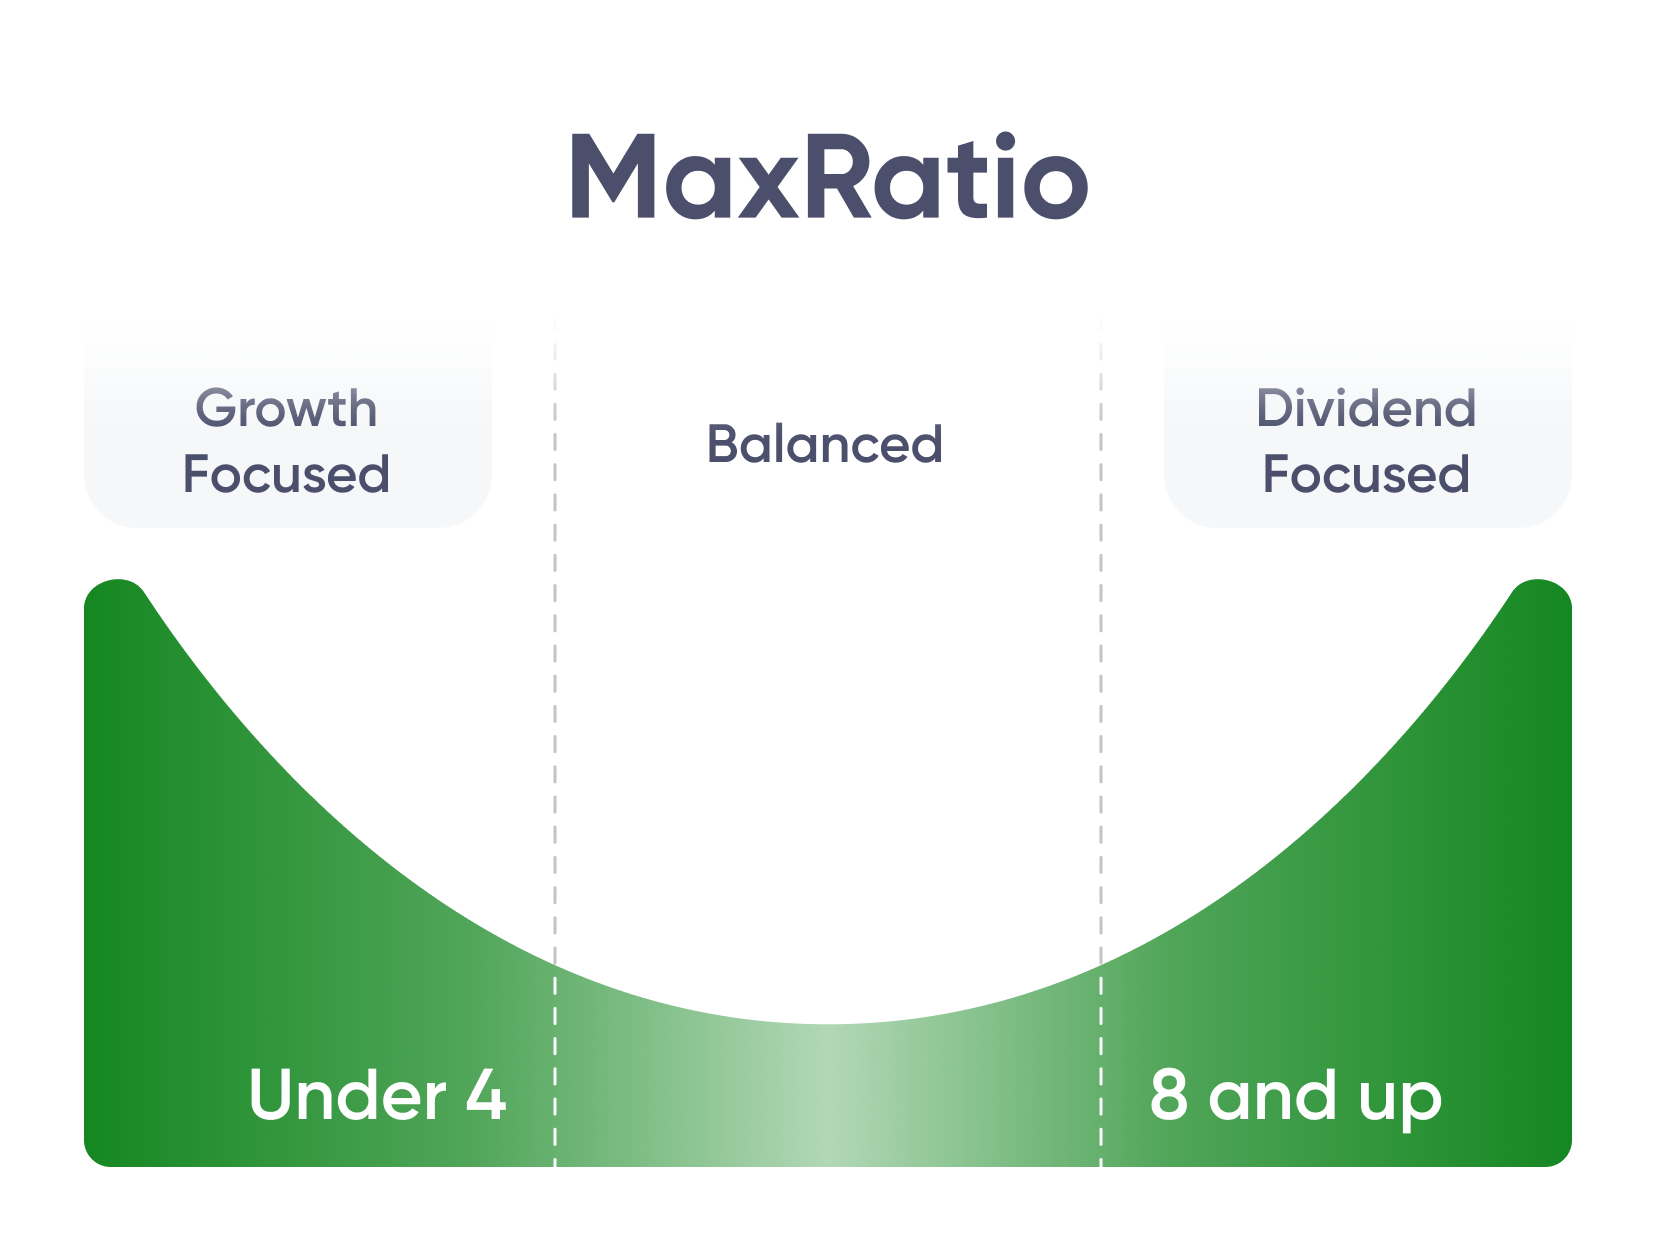
Max Ratio
–Croissance des dividendes sur 5 ans
0.00 %Croissance continue
–Historique des dividendes PACW
1 année
3 années
5 années
10 années
15 années
11/21/2021 - 11/28/2021


Amundi Prime All Country World UCITS ETF Inc
PACWPrix actuel
11.47 GBP
-0.064 GBP (-0.55%)
Entreprise
–
ISIN
-
Catégorie
Actions mixtes mondiales à grande capitalisation
Échange
London Exchange
Capitalisation
6 383 374 285 GBP
Rendement pour 12 mois
+18.56 %
1Y
3Y
5Y
10Y
15Y
PACW
Points Forts Avancés
Total des Actifs
6 383 374 285 GBPRatio de Frais Nets
–Rotation Annuelle des Participations
–Détention d'actifsPACW
Espèces
Long Terme
-
Court Terme
-
Actifs Nets
-
Les actions américaines
Long Terme
62.02%
Court Terme
-
Actifs Nets
62.02%
Actions hors États-Unis
Long Terme
37.94%
Court Terme
-
Actifs Nets
37.94%
Obligations
Long Terme
-
Court Terme
-
Actifs Nets
-
Autre
Long Terme
0.03%
Court Terme
-
Actifs Nets
0.03%
Efficacité PACW
Volatilité 1an
13.53%
Rendement YTD
13.86%
Volatilité 3ans
0.00%
Rendement 1an
22.88%
Rendement Prévu 3ans
0.00%
Rendement 3ans
Ratio de Sharpe 3ans
0.00%
Rendement 5ans
Rendement 10ans
Indicateurs techniques PACW
Pendant 52 semaines
6.97 GBP
8.64 GBP
Moyenne Mobile 50 jours
8.44 GBP
Moyenne Mobile 200 jours
7.97 GBP
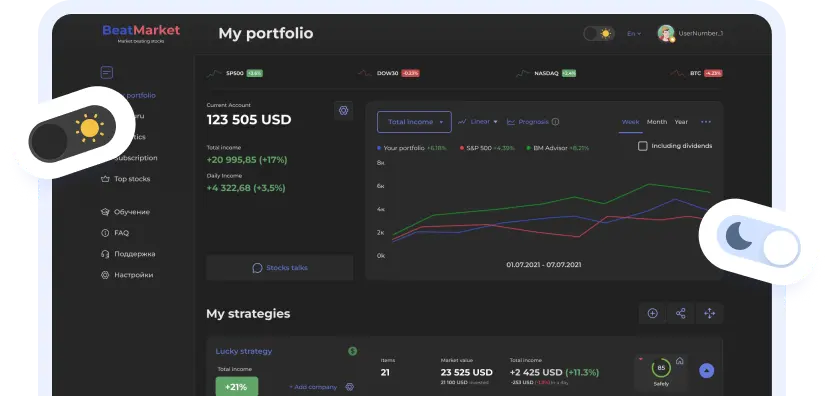

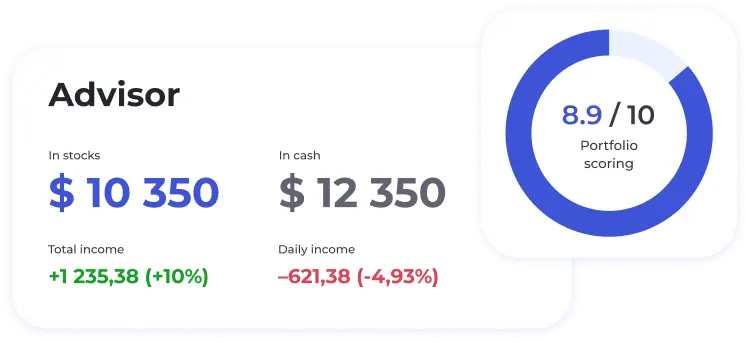






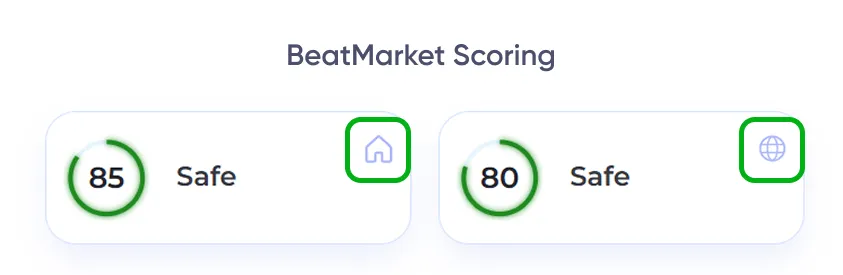
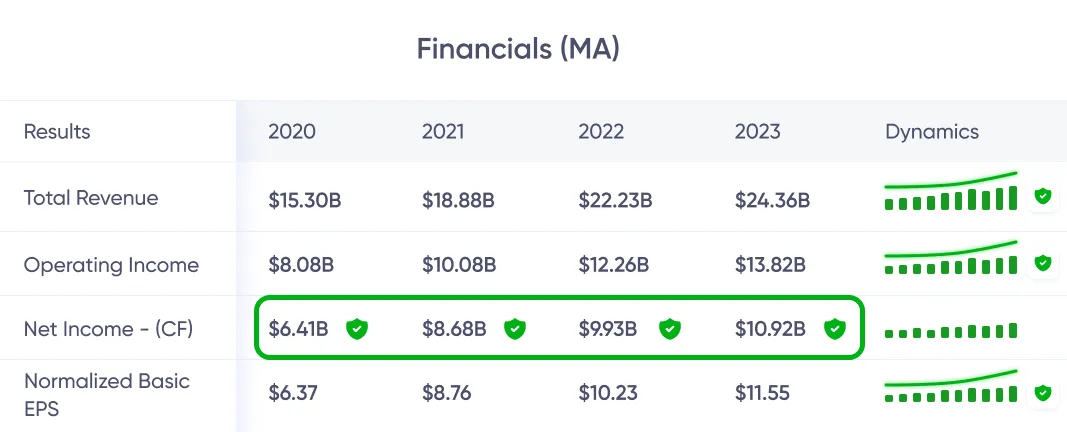
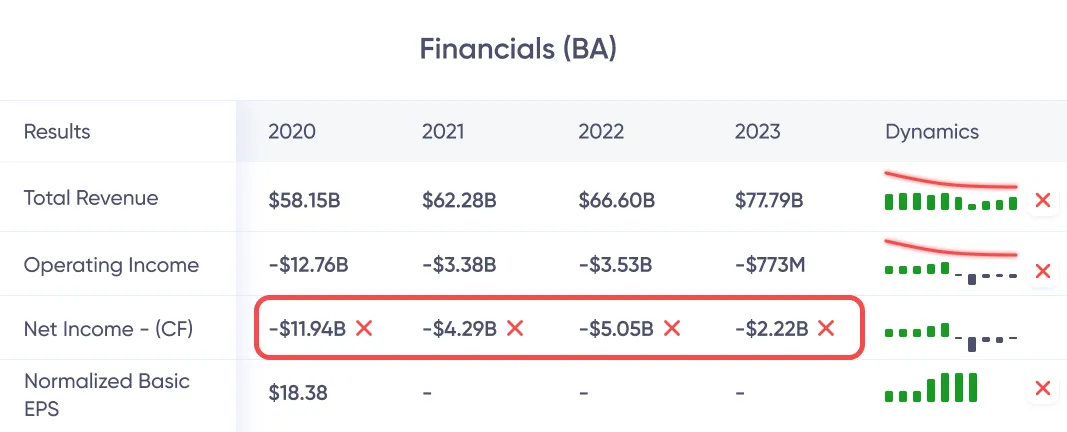


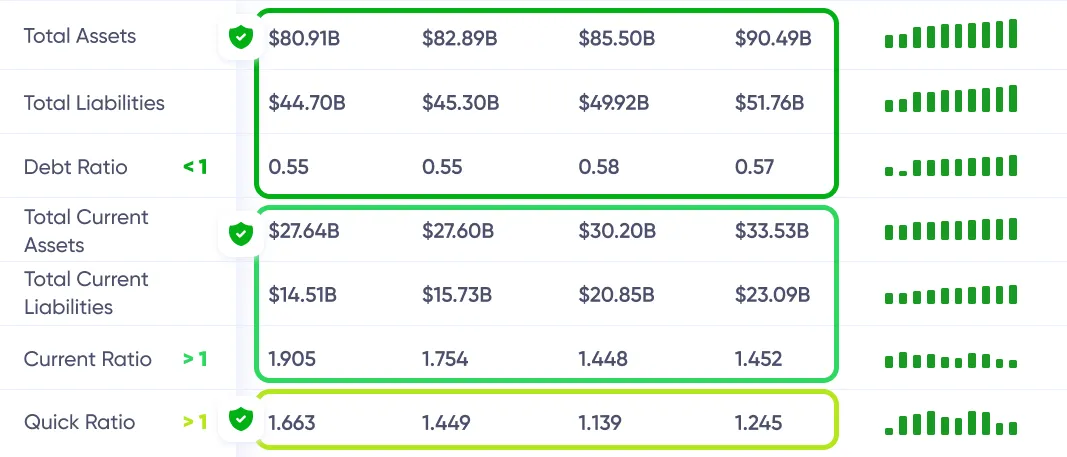
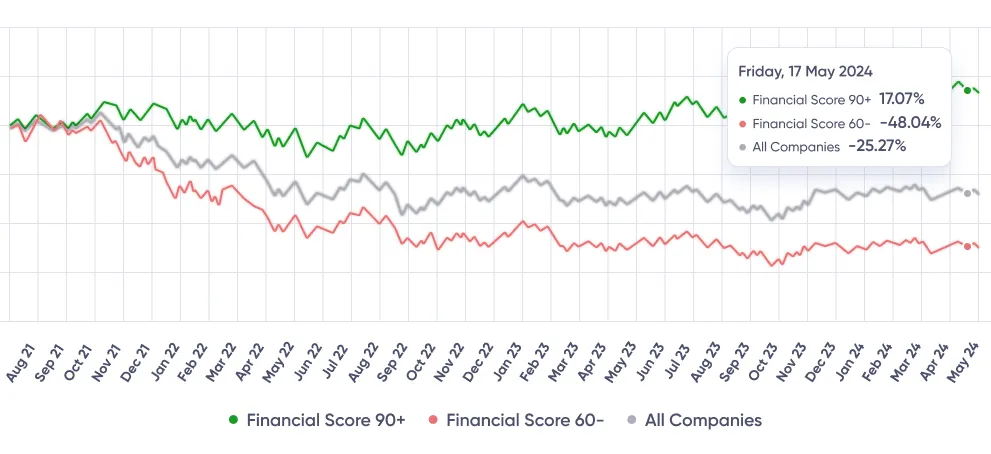
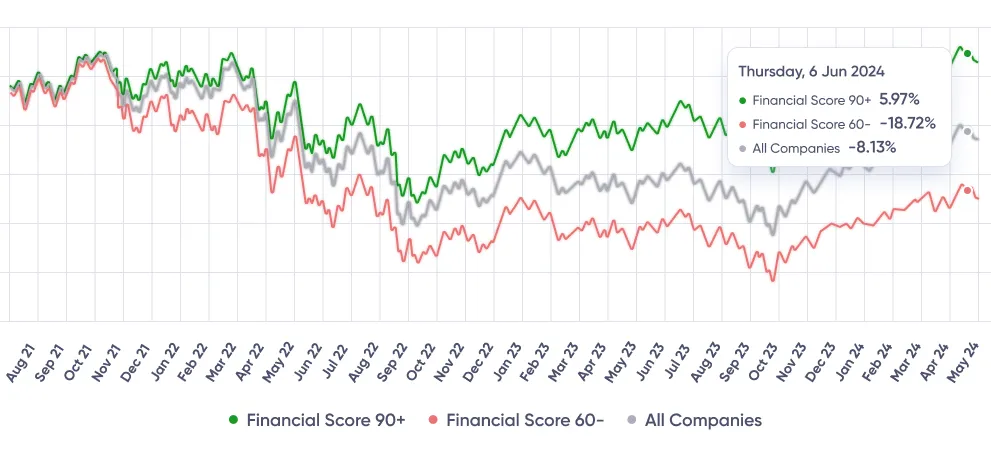
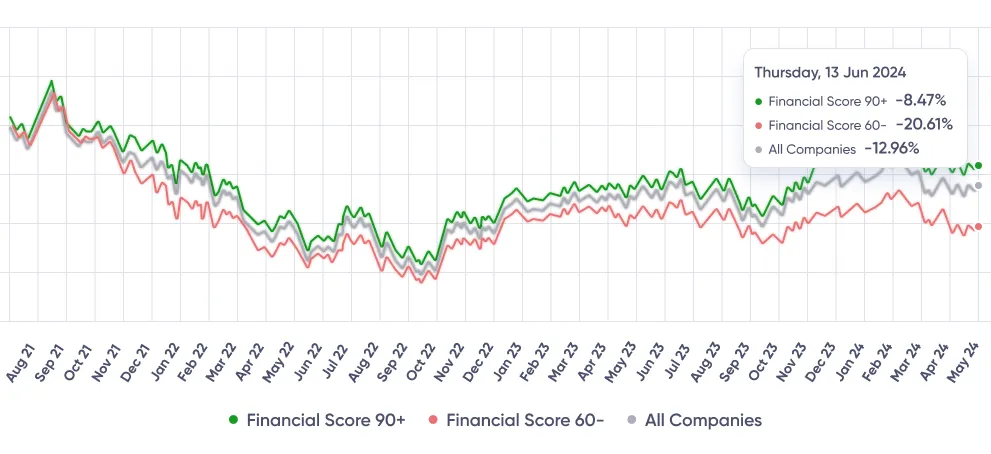
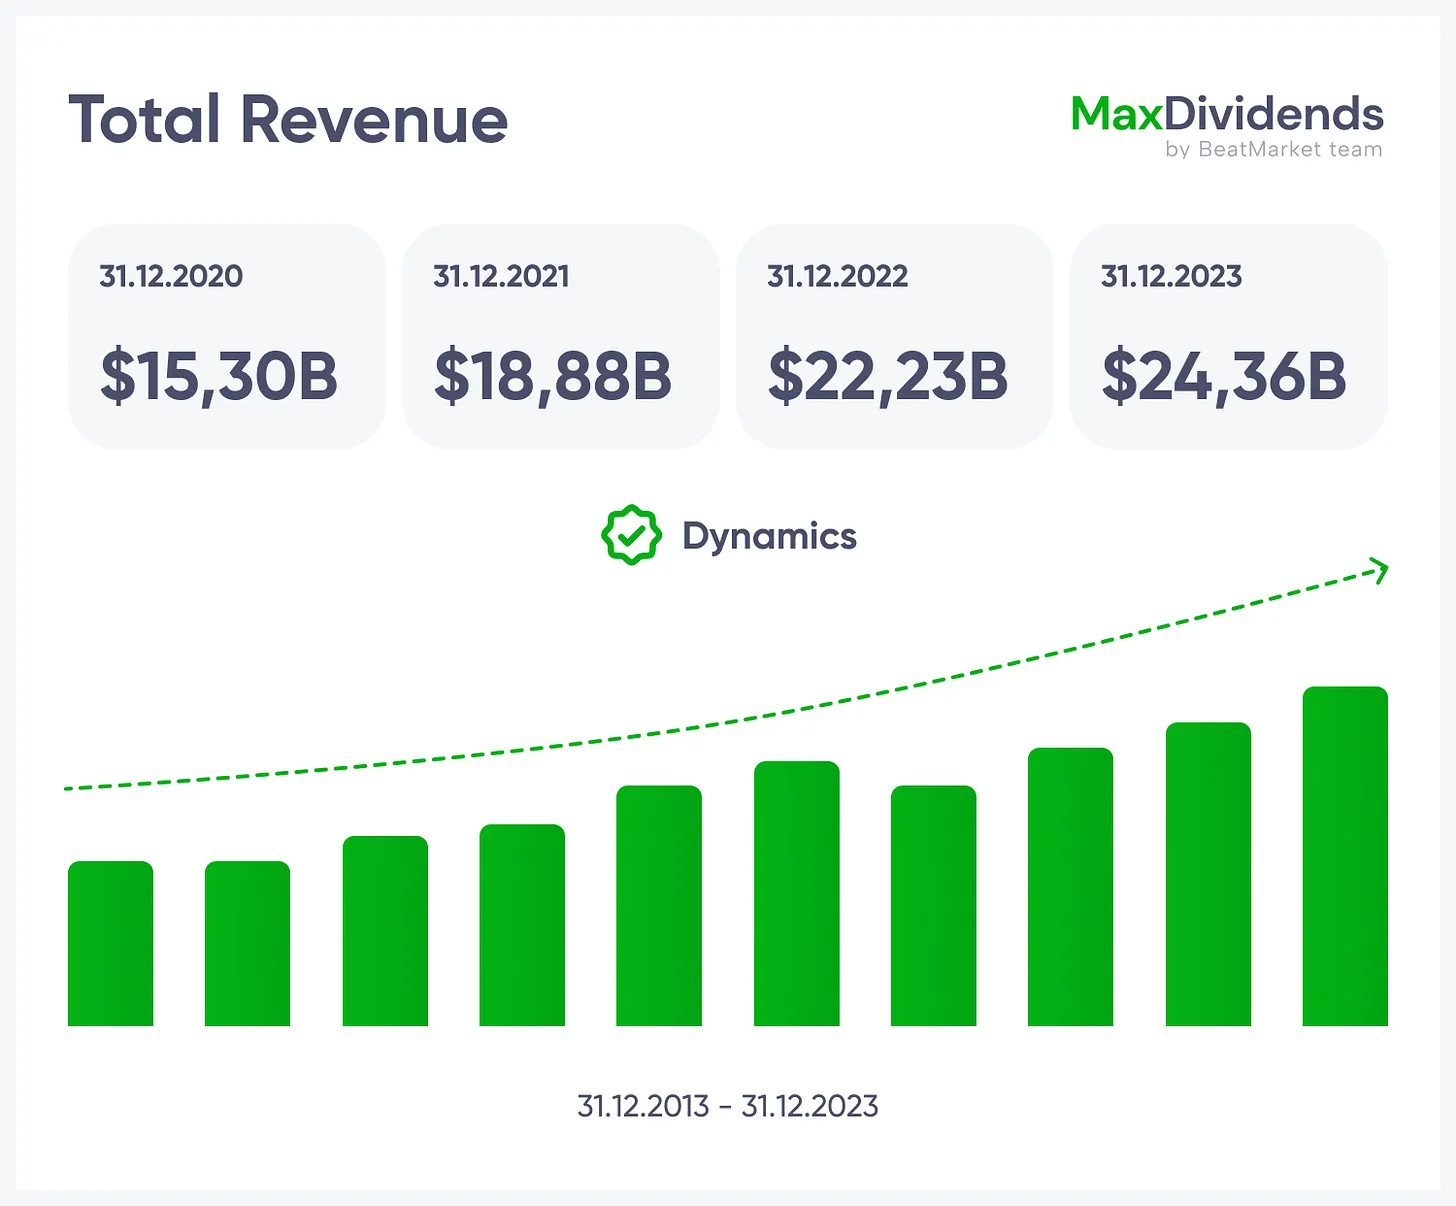
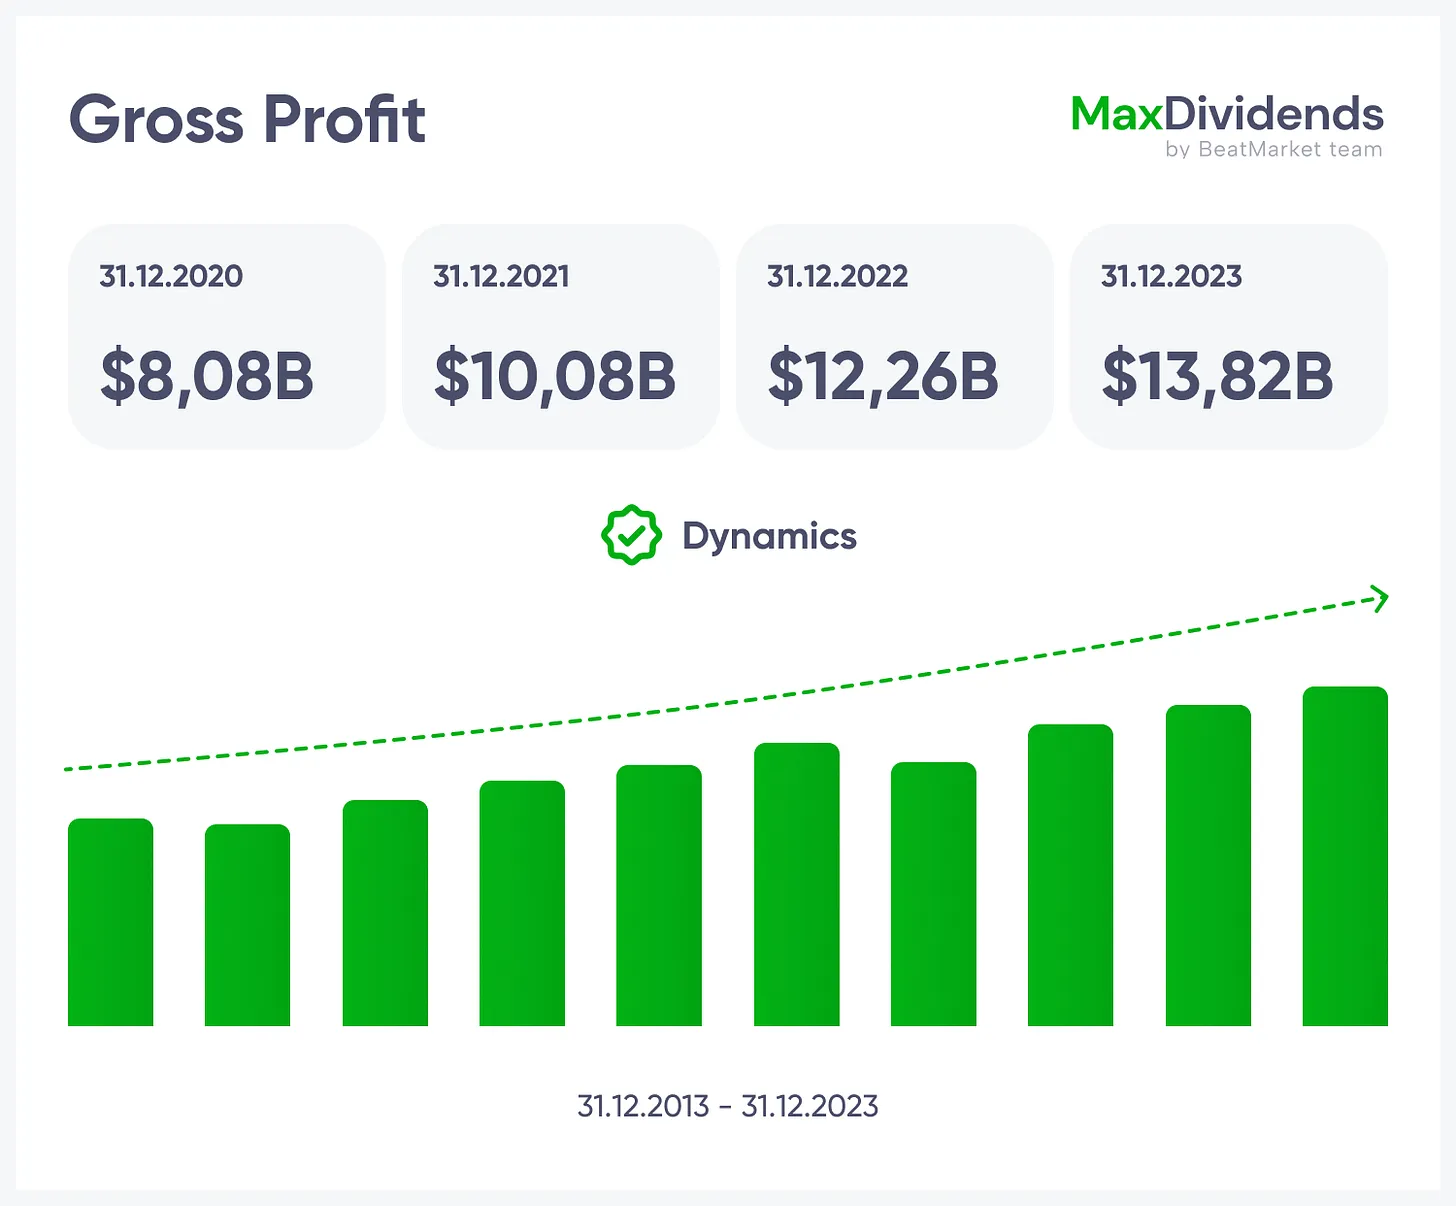
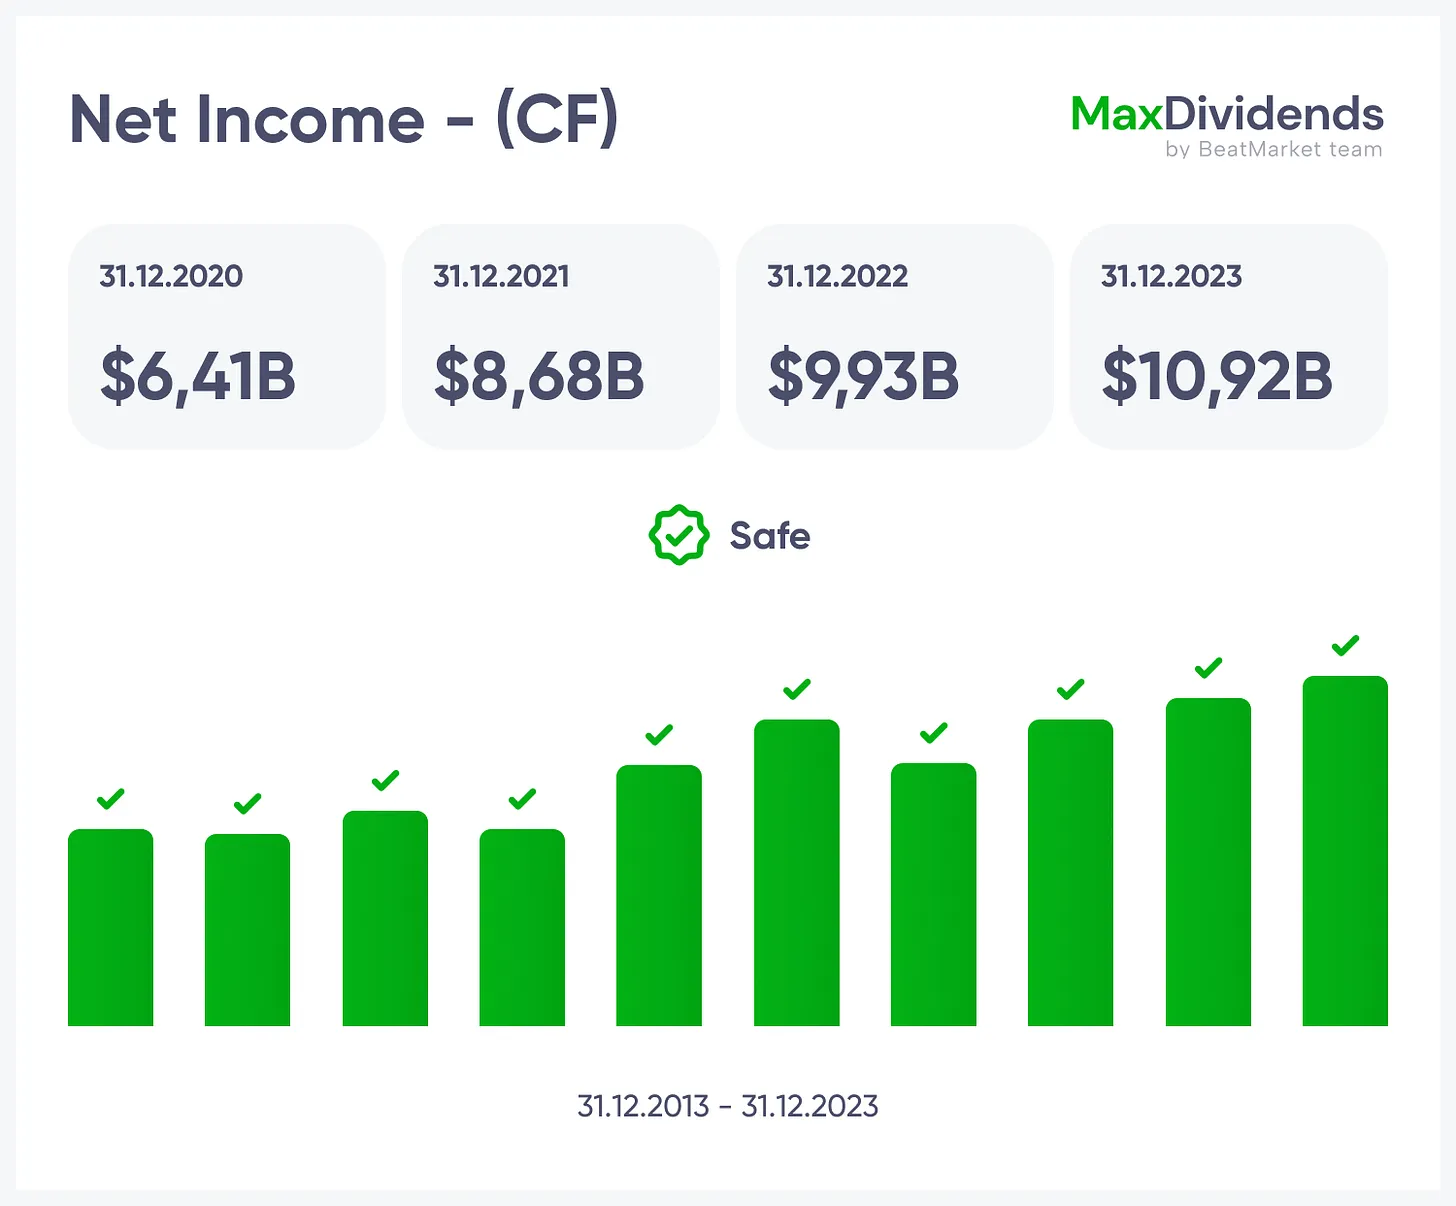
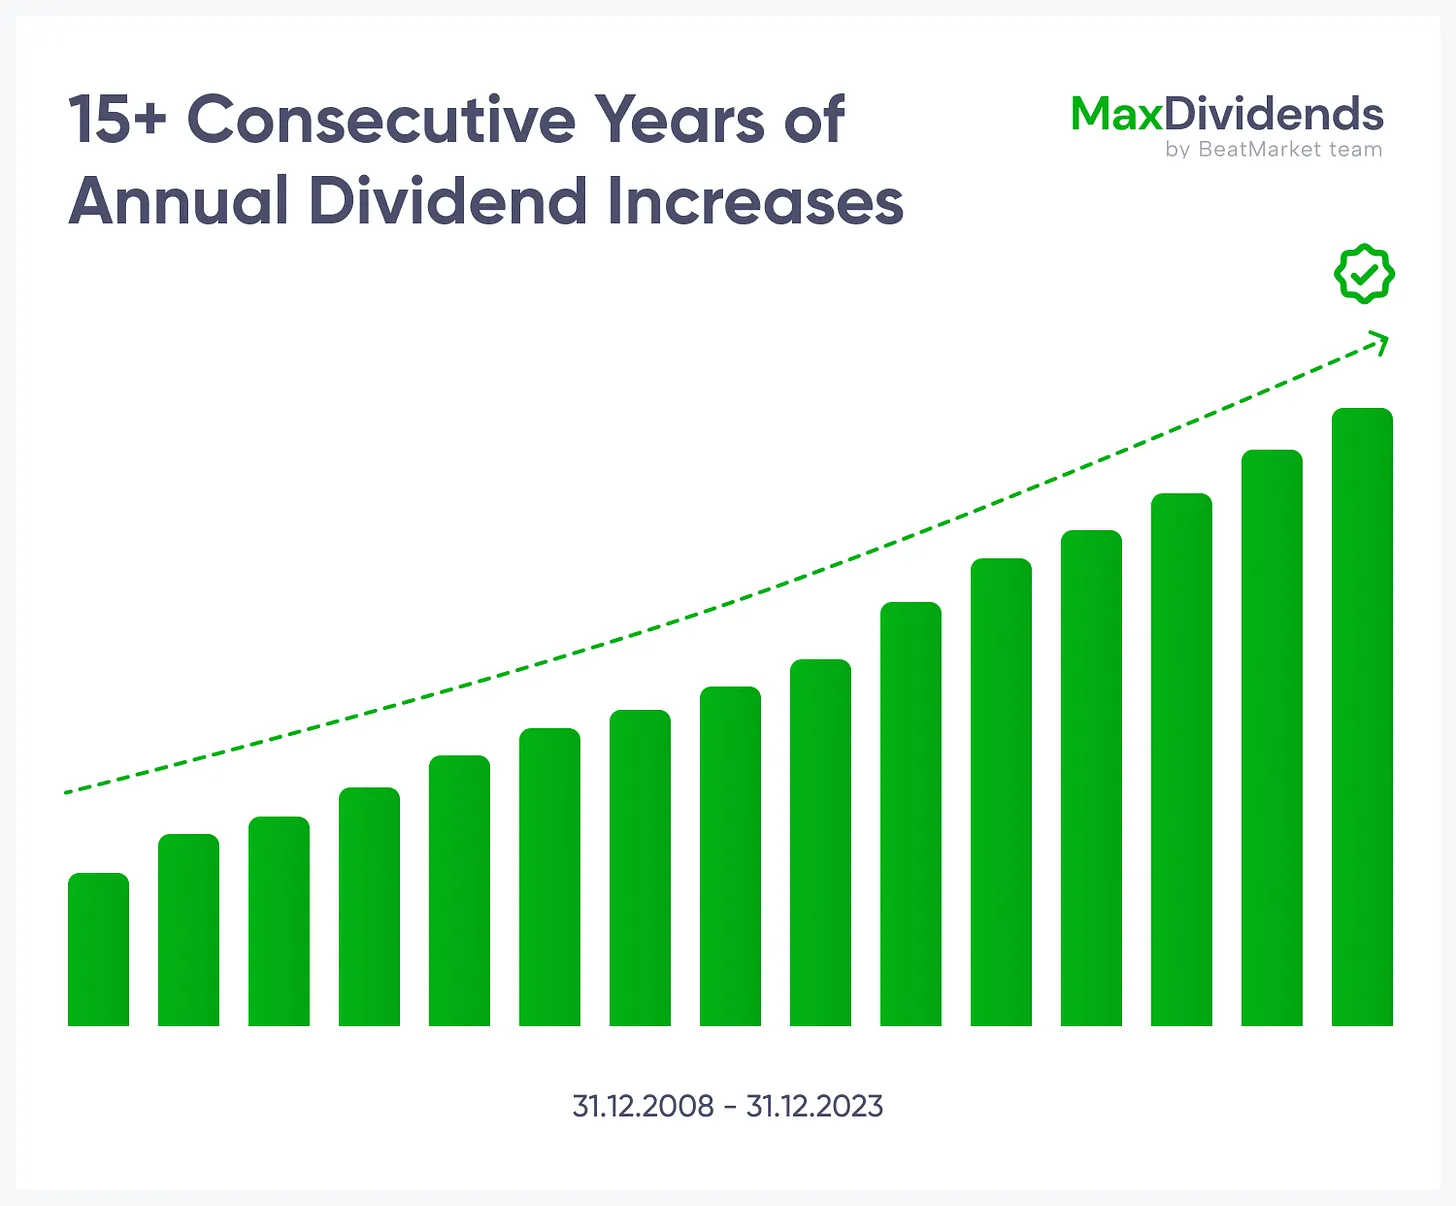
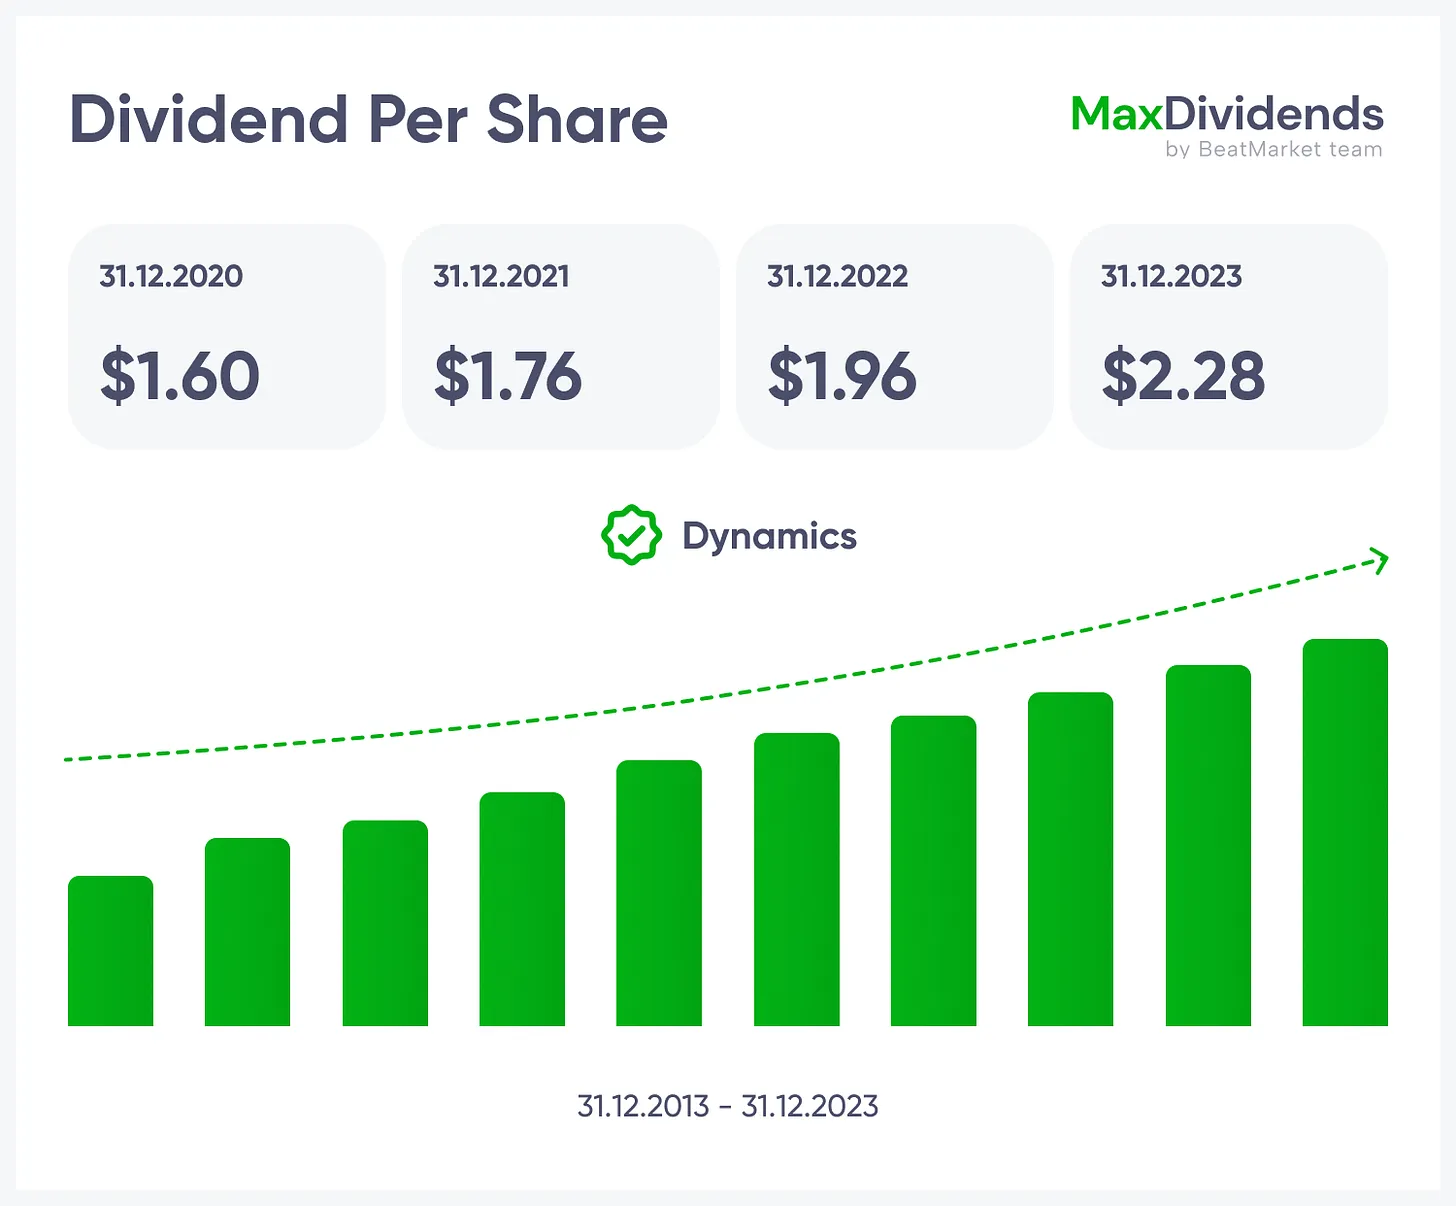
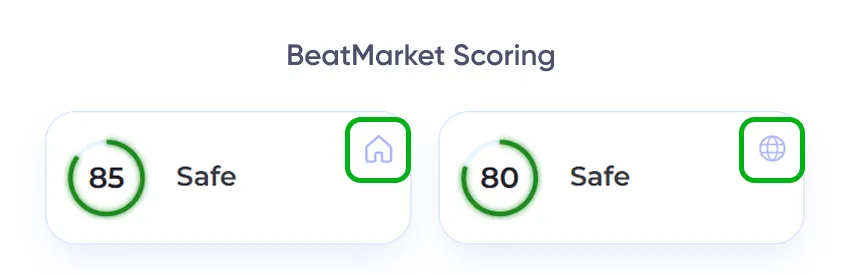
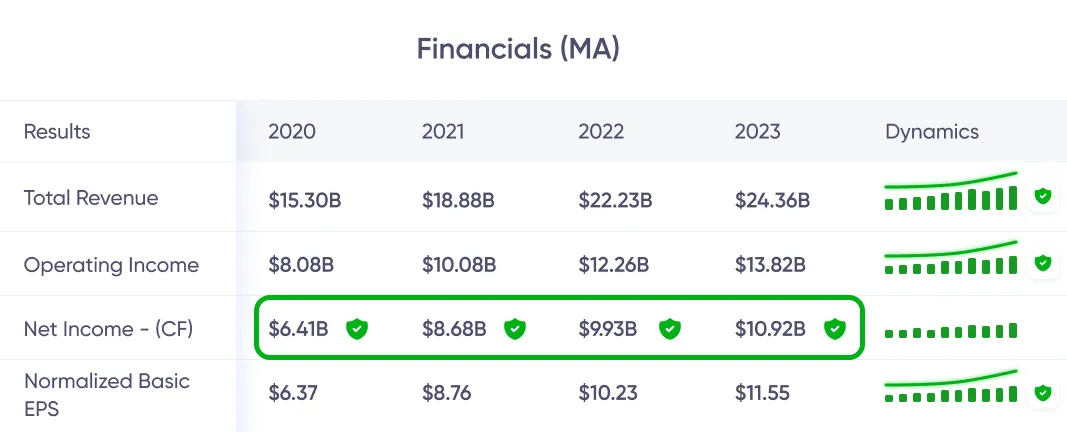



 Voyez l'entreprise entière en un coup d'œil — ce qu'elle fait, comment elle gagne de l'argent et la valeur qu'elle apporte.
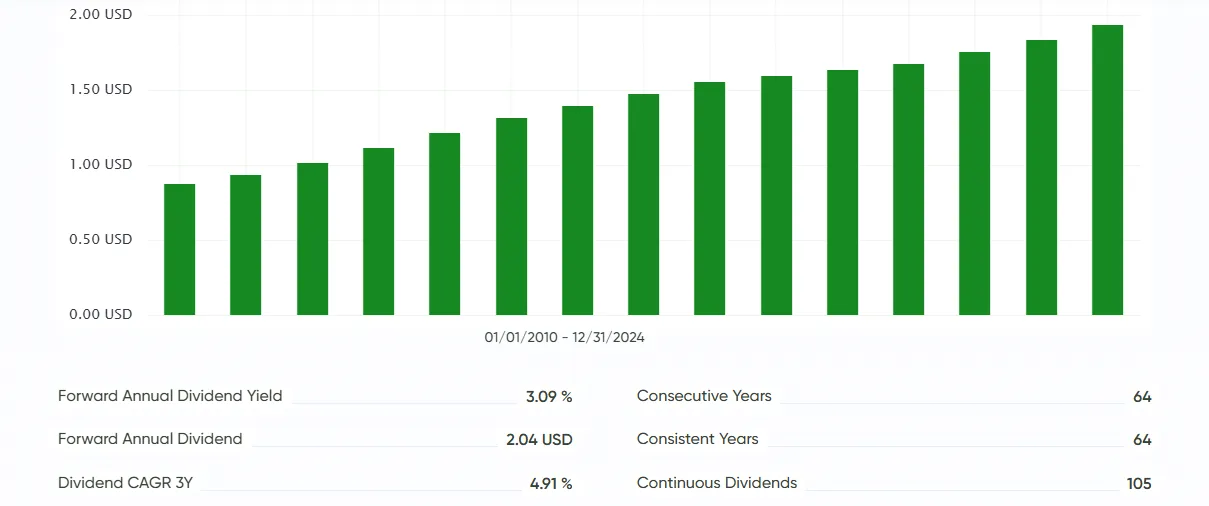
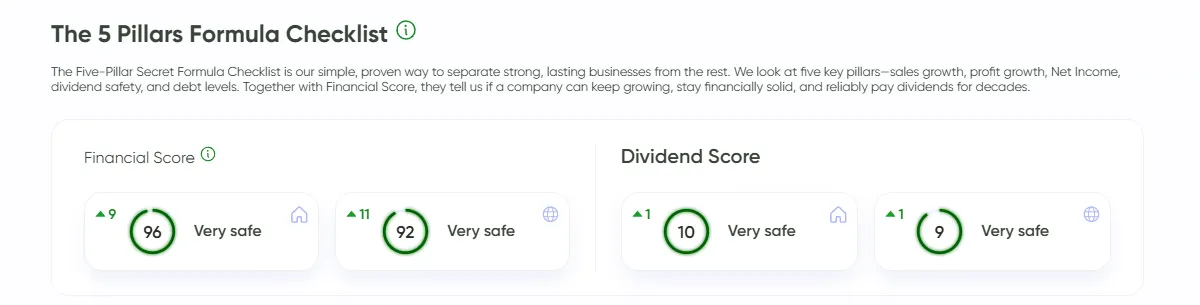
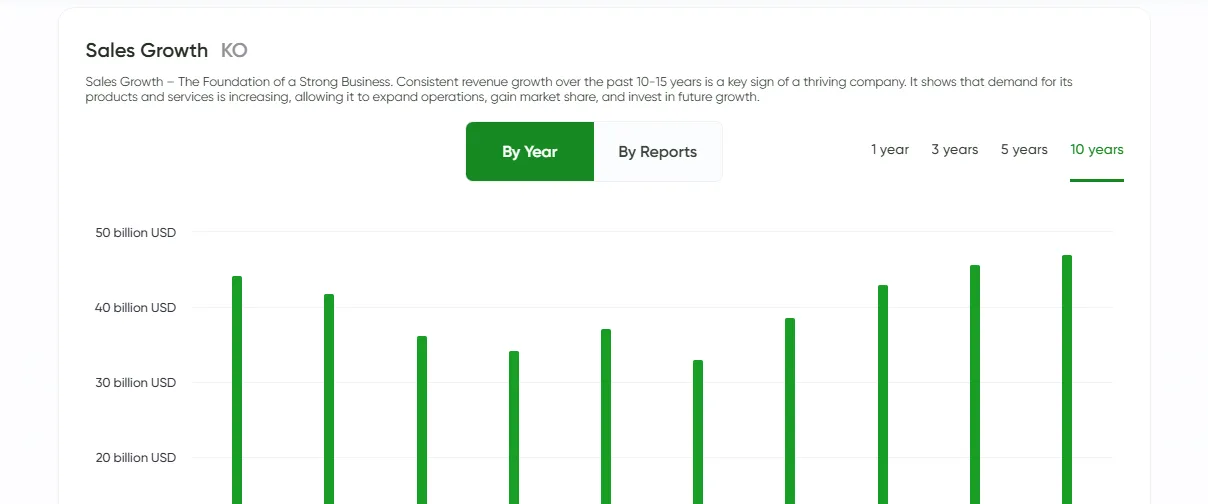 Tendance de croissance, claire en un coup d'œil.
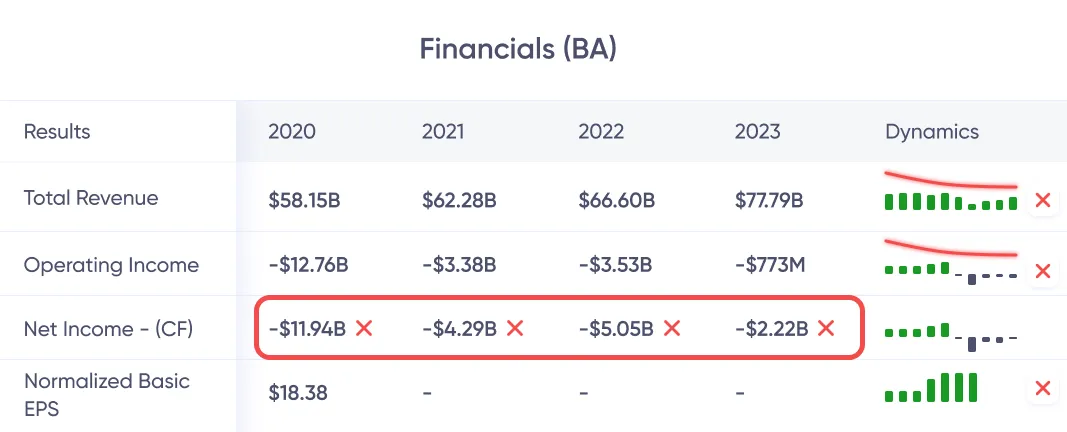
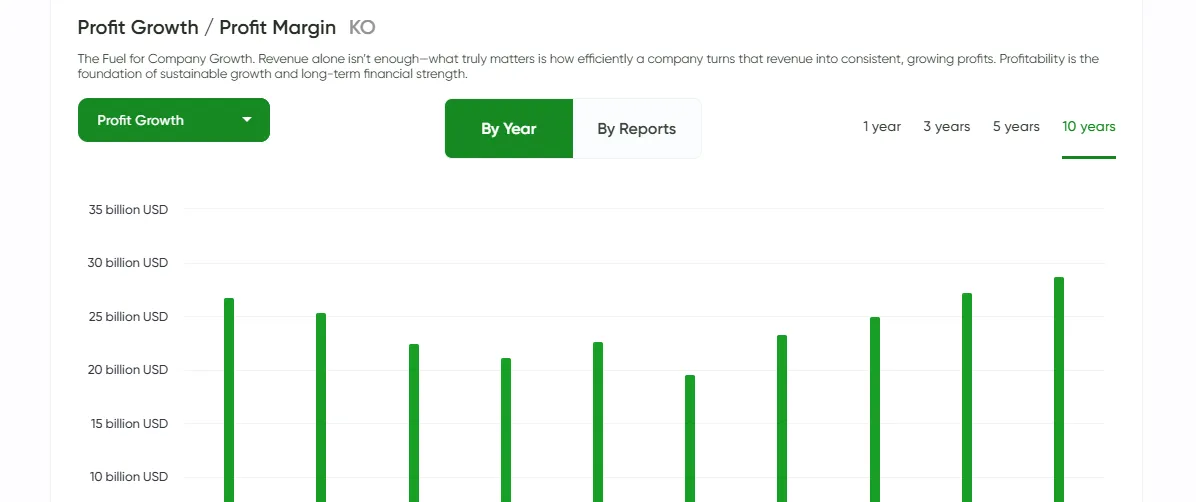 Voyez si les bénéfices sont réels — instantanément.
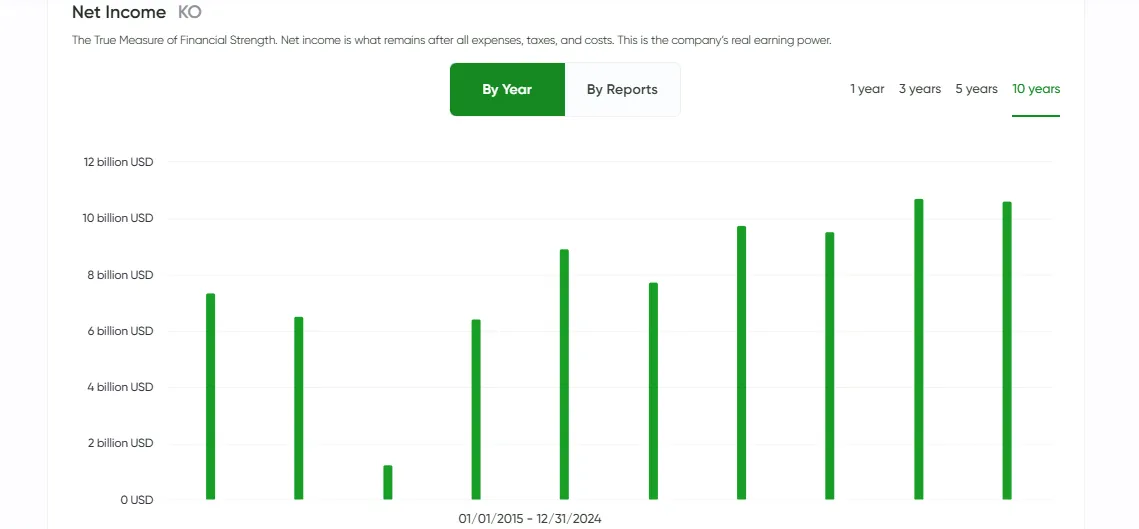 Le résultat net rendu simple avec MaxDividends.
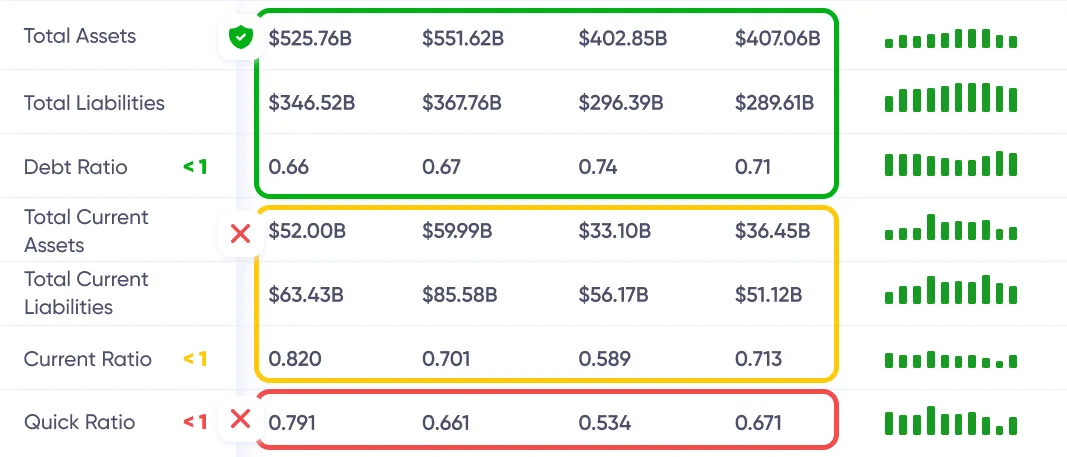
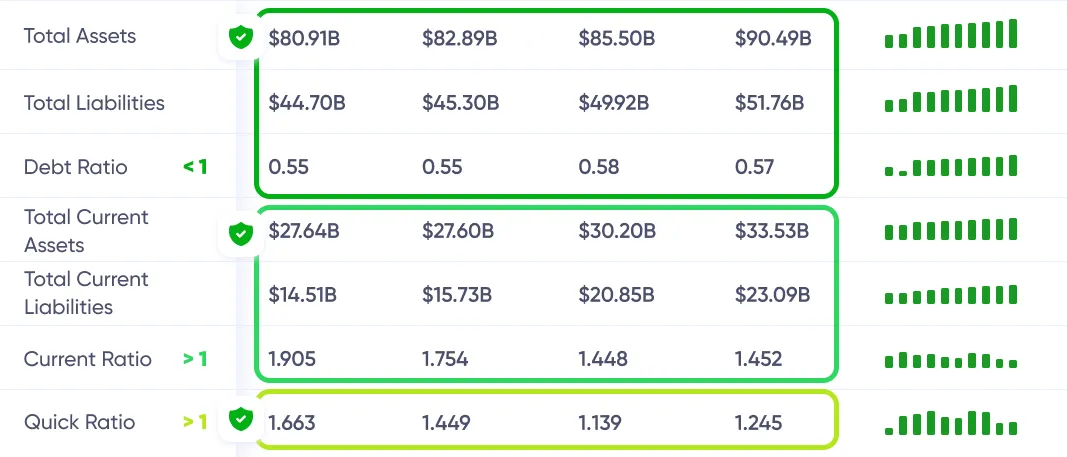
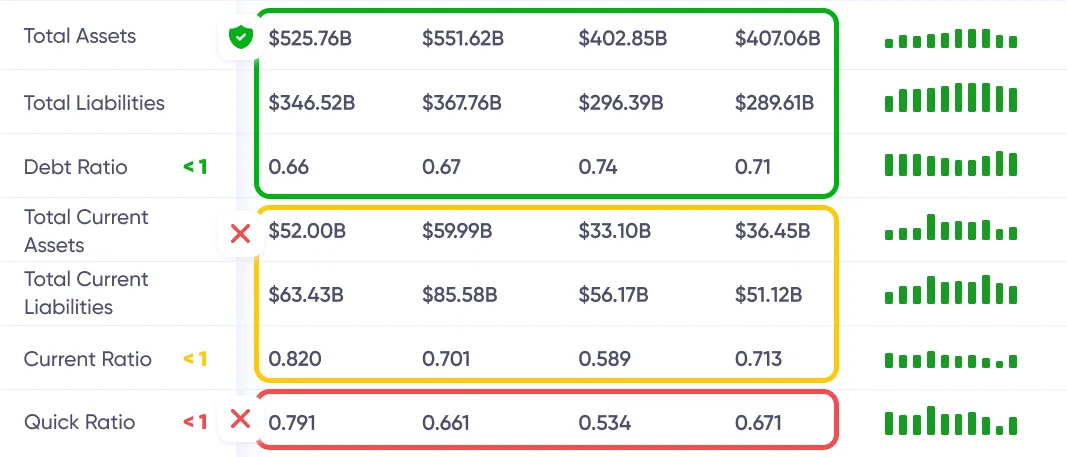
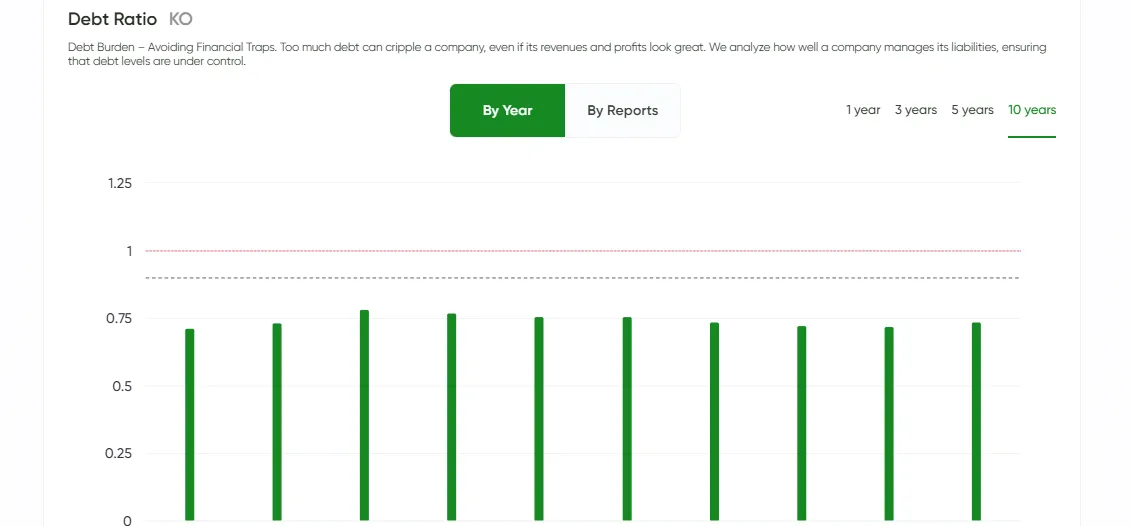 Risque de dette vérifié pour vous, 24h/24 et 7j/7.
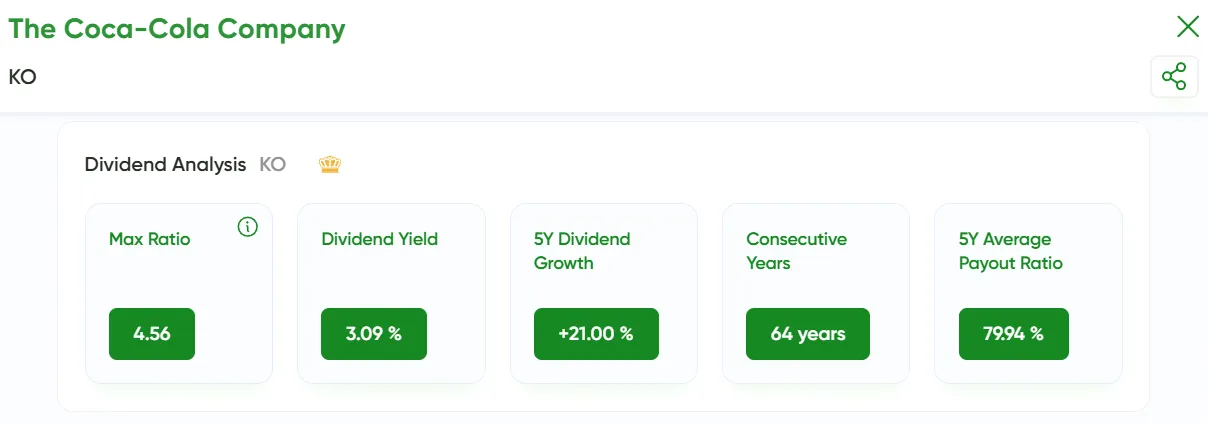
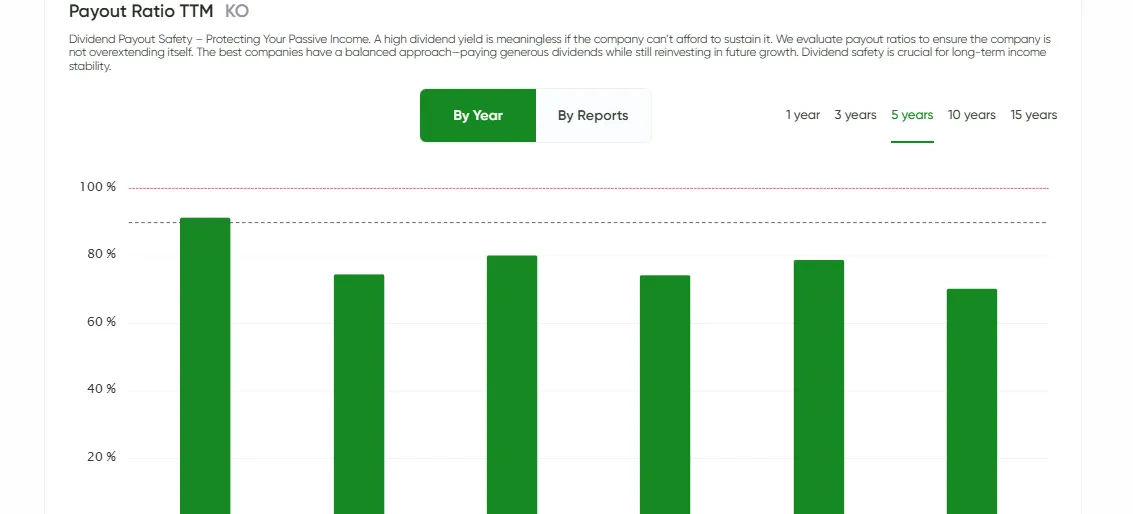 Séries et augmentations de dividendes à portée de main.
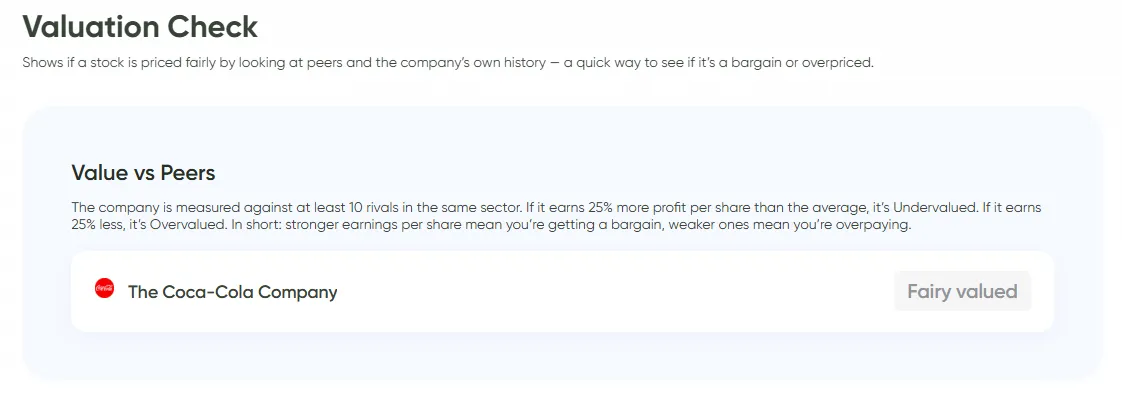 Stack the company against rivals. If it earns more per share, it's undervalued. If less, overpriced.
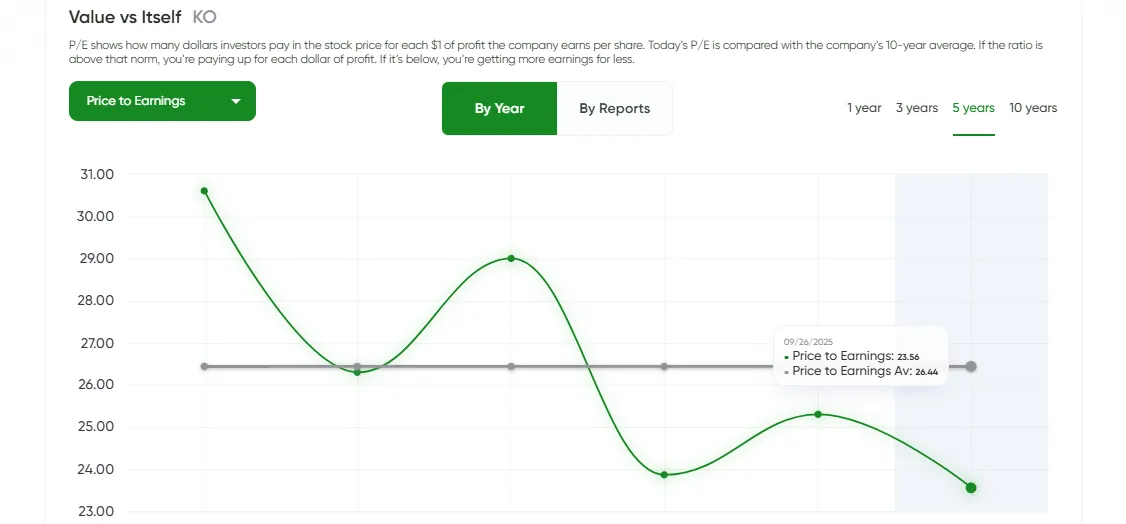 Compare today's P/E with its own 10-year history. Above average = expensive. Below = bargain.
 See if the stock trades below its assets. That's buying the business with built-in margin of safety.

 BeatStart